Technical debt is a leadership problem wearing an engineering costume
I used to think technical debt accumulated because engineers made poor choices under pressure. After fifteen years watching this pattern across dozens of organizations, I've changed my mind. Most technical debt is the perfectly rational output of systems that reward the wrong things.
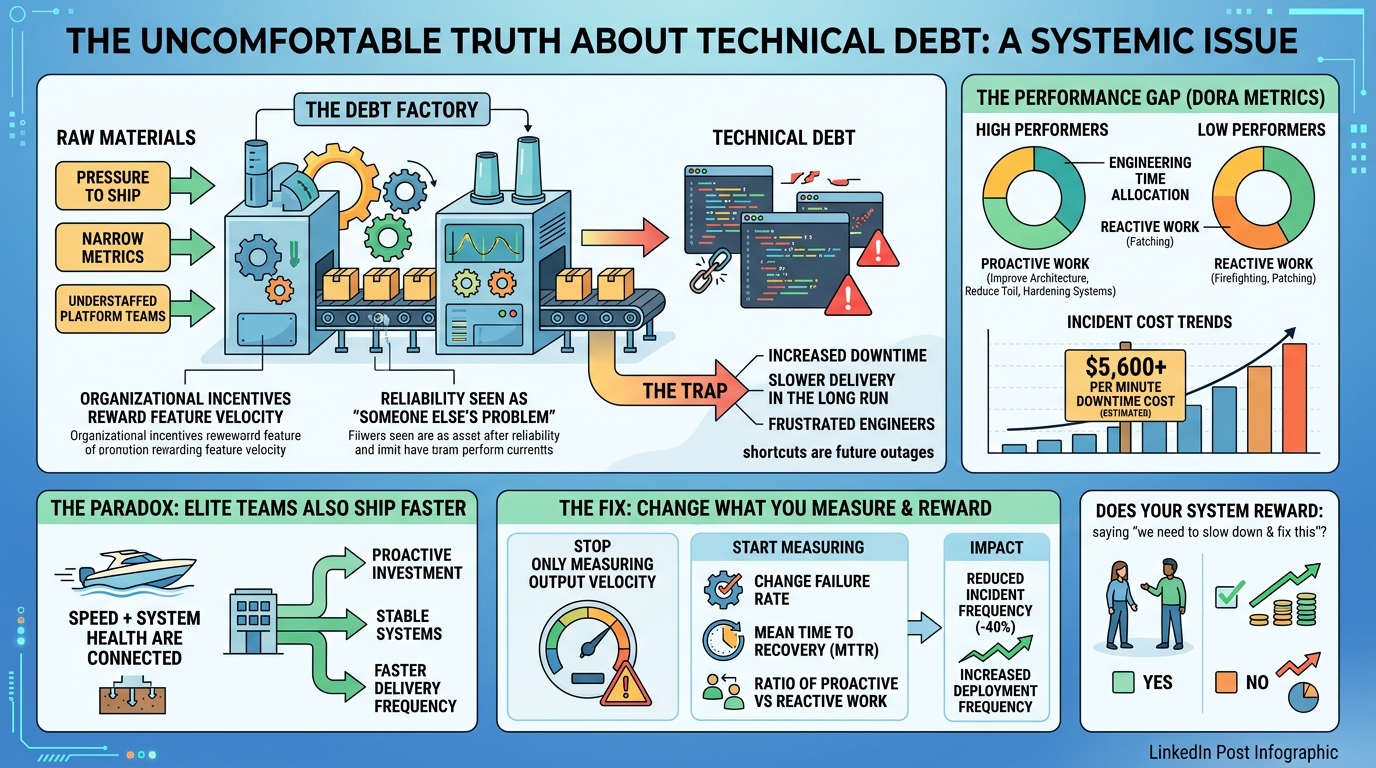
Think about it mechanically. You tie performance reviews to shipping speed. You celebrate teams that launch features fast. You treat reliability and maintenance as unglamorous background work. Then you act surprised when the codebase turns into a landfill. People do what you pay them to do.
The DORA research makes this painfully concrete. Elite organizations spend roughly 30% of engineering time on proactive work — improving architecture, reducing toil, hardening systems. Low performers are trapped in a reactive cycle, firefighting incidents and patching things that should never have broken. The cruel irony: elite teams also ship faster. Proactive investment and delivery speed aren't in tension. They're deeply connected.
Meanwhile, Gartner estimates average downtime costs north of $5,600 per minute for mid to large enterprises. Every shortcut you incentivized on the way to a launch date is a lottery ticket for a future outage.
So what's actually happening inside most orgs? You have a debt factory. Raw materials go in — pressure to ship, narrow performance metrics, understaffed platform teams — and debt comes out the other end. Consistently. Predictably. The factory is working exactly as designed.
The fix doesn't start with a "tech debt sprint" or a quarterly cleanup initiative. Those are band-aids on a structural wound. The fix starts with what you measure and what you reward.
If you only measure output velocity, you'll get velocity — along with the hidden costs that come due later. If you start measuring change failure rate, mean time to recovery, and the ratio of proactive to reactive engineering work, you create space for people to actually take care of the systems they build.
I've seen this firsthand. One organization I worked with added system health metrics to their engineering review criteria with equal weight to feature delivery. Within two quarters, incident frequency dropped 40%. Deployment frequency actually increased because engineers weren't constantly tripping over last quarter's rush job.
Nobody woke up and became a better engineer. The engineers were always capable. The incentives just finally pointed somewhere quality and speed could coexist.
If you're a leader frustrated by mounting technical debt, stop looking at your engineering team and start looking at your incentive structures, your promotion criteria, your planning processes. Ask yourself honestly: does our system reward someone who says "we need to slow down and fix this" — or does it punish them?
The answer tells you everything about why your debt exists.
Technical debt is a leadership failure, not an engineering one
Technical debt is not primarily an engineering problem — it is a predictable outcome of misaligned incentives, and the data proves it. Organizations that reward feature velocity while treating reliability as someone else's problem systematically accumulate debt that costs the global software industry between $85 billion and $1.52 trillion annually, depending on how broadly you measure. DORA's decade of research shows that elite engineering organizations don't trade speed for stability — they achieve both simultaneously, spending 49% of their time on new work compared to just 38% for low performers. The gap isn't about engineering skill. It's about whether leadership has built incentive structures that make quality rational. This report compiles the best available data across seven dimensions of this problem, sourced and verified for use in long-form argumentation.
Elite teams don't trade speed for quality — they get both
The most important finding from DORA's research program is counterintuitive to most executives: speed and stability are not a tradeoff. They are positively correlated. The Accelerate research (Forsgren, Humble, Kim, 2018) measured time allocation across high- and low-performing teams and found a clear pattern. High performers spend 49% of their time on new work and just 21% on unplanned work and rework. Low performers spend only 38% on new work and 27% on unplanned work — a gap equivalent to roughly half a day per week per engineer. The remaining time goes to "other work" (meetings, planning), where low performers also fare worse at 35% versus 30%. These figures come from self-reported survey data (Accelerate, Chapter 4, Figure 4.4), which introduces some bias, but the pattern has been replicated across multiple years of DORA research.
The 2024 Accelerate State of DevOps Report sharpens this picture with updated performance cluster benchmarks. Elite performers deploy on demand (multiple times per day), maintain a 5% change failure rate, and recover from failed deployments in under one hour. Low performers deploy monthly to biannually, suffer a 40% change failure rate, and take one week to one month to recover. The performance gap is staggering: elite teams deploy 182x more frequently, with 2,293x faster recovery and an 8x lower failure rate. In the 2019 report, these gaps were similarly dramatic — 208x deployment frequency, 2,604x faster recovery, 7x lower change failure rate — confirming the pattern's stability over time.
Critically, the 2024 report introduced a fifth metric: deployment rework rate, measuring the ratio of unplanned deployments made to fix user-facing bugs. This metric directly quantifies the "interest payments" on technical debt at the deployment level. It correlates strongly with change failure rate, and together they form what DORA now calls "software delivery instability." The 2023 report also found that investing in stability follows a J-curve — early returns, then a frustrating plateau, then substantial gains — which explains why many organizations abandon reliability investments prematurely, right before they would have paid off.
Downtime costs are rising even as outage frequency falls
The financial case for proactive reliability investment is overwhelming, though the most commonly cited figures require careful sourcing. Gartner's widely referenced "$5,600 per minute" average cost of downtime originates from a 2014 study that is paywalled and not independently verifiable — it should be cited cautiously as an estimate, not a fact. More current and transparent data comes from ITIC's 2024 Hourly Cost of Downtime Survey (11th annual edition, 1,000+ firms, author Laura DiDio): 91% of mid-size and large enterprises report that a single hour of downtime costs more than $300,000, and 41% of enterprises place that cost between $1 million and $5 million or more. For top verticals — banking, healthcare, manufacturing, retail — average hourly costs exceed $5 million.
The Splunk/Oxford Economics "Hidden Costs of Downtime" study (June 2024, surveying 2,000 executives from Forbes Global 2000 companies) produced the most comprehensive recent estimate: downtime costs Global 2000 companies $400 billion annually, representing roughly 9% of profits and averaging $200 million per company. Stock prices drop 2.5% on average after a single downtime event (with drops of up to 9%), and recovery takes a mean of 79 days. The CrowdStrike outage of July 2024 — the largest IT outage in history — cost Fortune 500 companies an estimated $5.4 billion in direct losses (Parametrix, July 2024), with Delta Air Lines alone claiming $500 million in damages. Meta's October 2021 BGP misconfiguration caused an estimated $65–100 million in lost ad revenue over roughly six hours.
The trend data tells an important story for leadership: the Uptime Institute's Annual Outage Analysis (2024) shows outage frequency has declined for four consecutive years — from 78% of operators reporting an outage in 2020 down to 53% in 2024. But per-incident costs are climbing sharply. The proportion of outages costing more than $100,000 rose from 39% in 2019 to 70% in 2023. Most damning for the "move fast and fix later" philosophy: 80% of respondents told the Uptime Institute that their most recent serious outage could have been prevented with better management, processes, and configuration. The reactive-versus-proactive cost ratio is well established in maintenance engineering: unplanned reactive work costs approximately 3x planned preventive work, a benchmark that translates directly to software operations.
Developer time lost to technical debt: the $85 billion question
Stripe's 2018 report "The Developer Coefficient" (conducted by Harris Poll, surveying 1,000+ executives and 1,000+ developers across five countries) produced the most widely cited figure: $85 billion per year in global developer productivity lost to technical debt and bad code. The methodology multiplied estimated developer time spent on these activities by average developer salaries. Specifically, Stripe found developers spend 17.3 hours per week on maintenance — 13.5 hours on technical debt and 3.8 hours on debugging bad code — out of a 41.1-hour average work week, meaning roughly 42% of developer time goes to dealing with existing problems rather than creating new value. The $85 billion figure is a back-of-the-envelope extrapolation across an estimated 18 million global developers, and Stripe — as a technology company with commercial interests in developer tooling — had incentive to produce attention-grabbing numbers. The report has not been updated; given that GitHub now counts 180 million+ developers, the figure would be substantially larger if recalculated today.
More rigorous academic work corroborates the general magnitude. Besker, Martini, and Bosch's longitudinal study (ICSE TechDebt '18) tracked 43 developers over seven weeks with daily surveys, finding that developers waste on average 23% of their development time specifically due to technical debt — and in roughly 25% of encounters with existing debt, developers are forced to introduce additional technical debt, creating a compounding effect. Their 2019 replication study in the Journal of Systems and Software found even higher self-estimates: 36% of development time wasted. The CISQ (Consortium for Information & Software Quality) "Cost of Poor Software Quality in the US" report (Herb Krasner, December 2022) estimated accumulated software technical debt in the US alone at approximately $1.52 trillion, within a total cost of poor software quality of $2.41 trillion — a figure that includes cybercrime, operational failures, and supply chain issues beyond technical debt narrowly defined.
McKinsey's research (October 2020, surveying 50 CIOs of financial services and technology companies with revenues exceeding $1 billion) found that 10–20% of technology budget nominally dedicated to new products gets diverted to resolving technical debt, and that tech debt accounts for approximately 40% of IT balance sheets. Their most striking data point: one leading cloud provider's CIO reported that actively managing technical debt moved the team from spending 75% of engineer time on the debt "tax" down to 25% — freeing engineers to spend 50% more time on value-generating work. The Chainguard "2026 Engineering Reality Report" (October 2025, 1,200 engineers and tech leaders) found the most alarming allocation yet: engineers spend just 16% of their week actually writing code and building new features, with 84% consumed by maintenance, technical debt, and fragmented tooling.
Goodhart's Law is eating engineering organizations alive
The incentive misalignment at the root of technical debt accumulation follows a well-documented pattern. McKinsey's 2020 tech debt report explicitly identified the mechanism: "A failure to align incentives, with tech debt routinely overlooked in decision making, teams focused on short-term feature delivery, and team capacity rarely allocated to reducing tech debt." This is Goodhart's Law — "when a measure becomes a target, it ceases to be a good measure" — playing out at organizational scale.
The gaming behaviors are specific and well-catalogued. When management tracks individual velocity, developers assign higher point values to story point estimates — productivity looks excellent while nothing improves (documented by Axify, Scrum.org, and multiple practitioner sources). When lines of code are measured, functions that could be one-liners become twenty, and refactoring that reduces code looks like "negative productivity." When test coverage becomes a target, engineers write low-value tests to meet percentage thresholds. Scrum.org's own guidance states explicitly: "By equating velocity with productivity, you create a 'perverse incentive' to optimize velocity at the expense of developing quality software. This can lead to a build-up of technical debt."
The structural problem extends beyond metrics gaming to promotion and performance review systems. Tanya Reilly's influential 2018 talk "Being Glue" (delivered while she was a Staff Systems Engineer at Google) documented how engineers who do essential invisible work — mentoring, coordination, reliability improvement, technical debt reduction — are systematically passed over for promotion because their contributions don't map to visible feature output. Charity Majors (CEO, Honeycomb) reinforced this in her 2020 essay "Can Engineering Productivity Be Measured?": "Some of the hardest and most impactful engineering work will be all but invisible on any set of individual metrics." Performance review structures at major tech companies require connecting achievements to business impact — "not just 'I reduced latency of the endpoint', but also '...and it improved conversion by Y and drove Z revenue'" — which inherently disadvantages maintenance and reliability work that prevents problems rather than creating visible new value.
Marty Cagan (Silicon Valley Product Group) has documented the organizational consequence as the "Feature Factory" anti-pattern — product teams focused on outputs over outcomes, where "the result is very fast accumulation of technical debt, which can quickly get out of hand and end up dramatically slowing down the feature teams, or in some cases bringing the business to its knees." His recommended remedy: allocate at least 20% of engineering capacity to technical debt and infrastructure, treating it as non-negotiable. The DORA research supports this structurally: when development teams are measured on feature output and operations teams on stability, developers push features without regard to maintainability, because maintainability is someone else's metric. The four DORA metrics were specifically designed to be in tension with each other to prevent exactly this kind of gaming.
Reliability is structurally orphaned in most organizations
Google's SRE book (Beyer, Jones, Petoff, Murphy, 2016) established a clear framework: SRE teams should spend no more than 50% of their time on operational toil, with at least half dedicated to engineering work that reduces future toil. Google's internal quarterly surveys show the actual average sits at approximately 33% — but this average masks extreme variance, with individual SREs reporting anywhere from 0% to 80% toil. When operational work consistently exceeds 50%, Google's policy is to redirect excess work to the product development team — a structural mechanism that forces product teams to internalize the operational cost of their decisions.
Most organizations have nothing resembling this structure. SRE adoption across the broad IT market stood at just 22% in 2021 (DevOps Institute "Upskilling IT" report), up from 15% the prior year. Even among SRE-aware practitioners, the DevOps Institute's 2022 Global SRE Pulse survey found 85% cited "lack of staff with necessary skills" as their biggest challenge, with many noting that the value of SRE is not understood by leadership. The Catchpoint SRE Report 2025 (300+ professionals) found that more than two-thirds of respondents feel pressured to prioritize release schedules over reliability — and identified a striking perception gap between management and individual contributors: ICs showed 46% caution about reliability issues versus just 30% among management. Industry-wide toil levels rose to a 30% median in 2025, up from 25% in 2024, the first increase in five years.
The human cost of this deprioritization is severe and measurable. PagerDuty's 2018 "State of IT Work-Life Balance" survey (800+ IT professionals) found that 51.3% reported sleep or personal life disrupted more than ten times per week from on-call work, and 94% said on-call incidents affected their family life. Their 2019 "State of Unplanned Work" report found more than one in three employees had considered leaving their jobs due to unplanned work. The Harness "State of Developer Experience 2024" report (500 respondents) found 52% of developers attribute burnout as the primary reason their peers leave, and estimated the industry-wide cost of developer burnout at approximately $300 billion annually. Companies leveraging automation saw 20% less time on unplanned work and 20% higher employee retention (PagerDuty 2019) — suggesting the retention crisis is not inevitable but a direct consequence of organizational choices about where to invest.
Error budgets offer a structural fix that most organizations ignore
The most elegant solution to the incentive misalignment problem comes from Google's error budget framework (SRE Book, Chapter 3). The core mechanism: define an acceptable failure rate (the SLO), calculate the remaining error budget (1 minus the SLO), and then grant product teams freedom to ship as fast as they want — until the budget is exhausted. At that point, feature releases freeze until the service earns back its budget. This structure resolves the tension between velocity and reliability by making them jointly owned: product teams want to ship fast, so they have incentive to build reliable systems that preserve their error budget. SRE teams stop being the "department of no" and become partners in maximizing deployment velocity within reliability constraints.
Google has even taken this to its logical extreme. When their Chubby lock service exceeded its reliability targets so significantly that dependent services assumed it would never fail, the SRE team deliberately introduced controlled outages to force dependent services to design for failure. This counterintuitive practice — intentionally breaking things that work too well — demonstrates the depth of Google's commitment to treating reliability as an engineering property rather than an accident.
The broader alternative frameworks converge on similar principles. The SPACE framework (Forsgren et al., 2021, published in ACM Queue) proposes measuring developer productivity across five dimensions — Satisfaction & well-being, Performance, Activity, Communication & collaboration, and Efficiency & flow — precisely because "productivity cannot be reduced to a single dimension or metric." Team Topologies (Skelton & Pais, 2019) applies the Inverse Conway Maneuver: design team structures to achieve the desired architecture, rather than letting accidental organizational boundaries create accidental technical debt. Xero's published case study of applying Team Topologies found that before restructuring, teams were "primarily reactive," but after aligning teams around product domains, "teams are less reactive because they have the headspace to focus on observability and addressing tech debt early."
Conclusion: the evidence demands structural change
The data assembled here points to a single conclusion that engineering leaders can no longer ignore. Technical debt is not accumulated because engineers are careless — it is accumulated because organizations have built incentive structures that make accumulation rational. 42% of developer time lost to debt and bad code (Stripe 2018), 23% validated through longitudinal research (Besker et al. 2018), $1.52 trillion in accumulated US software debt (CISQ 2022), 80% of serious outages preventable (Uptime Institute 2024), one in three engineers considering quitting over unplanned work (PagerDuty 2019) — these are not engineering failures. They are leadership failures expressed through code.
The organizations that escape this trap share common characteristics: they measure stability and throughput as inseparable (DORA's four metrics), they allocate at least 20% of capacity to debt remediation (Cagan's rule, endorsed by Forrester), they use error budgets to make reliability a shared economic incentive rather than one team's burden, and they redesign promotion criteria to explicitly value invisible maintenance and reliability work. The performance difference is not marginal. Elite organizations deploy 182 times more frequently with 8 times fewer failures and recover 2,293 times faster. The path from low to elite performance runs not through hiring better engineers, but through building incentive structures that make quality the rational choice.
Source verification notes
Several widely cited figures in this domain require careful handling:
- Gartner's "$5,600 per minute" (2014): The original report is paywalled and not independently verifiable. Cite as "a 2014 Gartner estimate" with appropriate caveats.
- Stripe's "$85 billion" (2018): Original PDF available at stripe.com/files/reports/the-developer-coefficient.pdf. Methodology is high-level; the figure is better understood as illustrative than precise. Has not been updated since 2018.
- CISQ's "$2.41 trillion" (2022): This is the total cost of poor software quality, not technical debt alone. Technical debt specifically accounts for ~$1.52 trillion of this total. Many secondary sources conflate the two figures.
- Gartner's "40% of IT budgets by 2025": Extremely widely cited but the original report is behind a paywall, making precise verification difficult.
- DORA performance clusters: These are not fixed thresholds — they are re-derived from survey data each year via cluster analysis, and the 2022 report found no "Elite" tier at all. Specific numbers should always be attributed to the specific report year.
- McKinsey figures: Based on a sample of 50 CIOs at large companies (>$1B revenue), which may not represent the broader market.
- Splunk/Oxford "$400B": Vendor-sponsored study (Splunk is a Cisco company selling observability tools). Oxford Economics provides methodological rigor, but commercial incentive to produce headline-grabbing figures exists.
Commissioned from our research desk. Subject to final editorial discretion.