Every few years, someone pulls out a buy-vs-build framework. Two columns, some weighted criteria, a score at the bottom. The team picks a winner and moves on.
That's where the trouble starts.
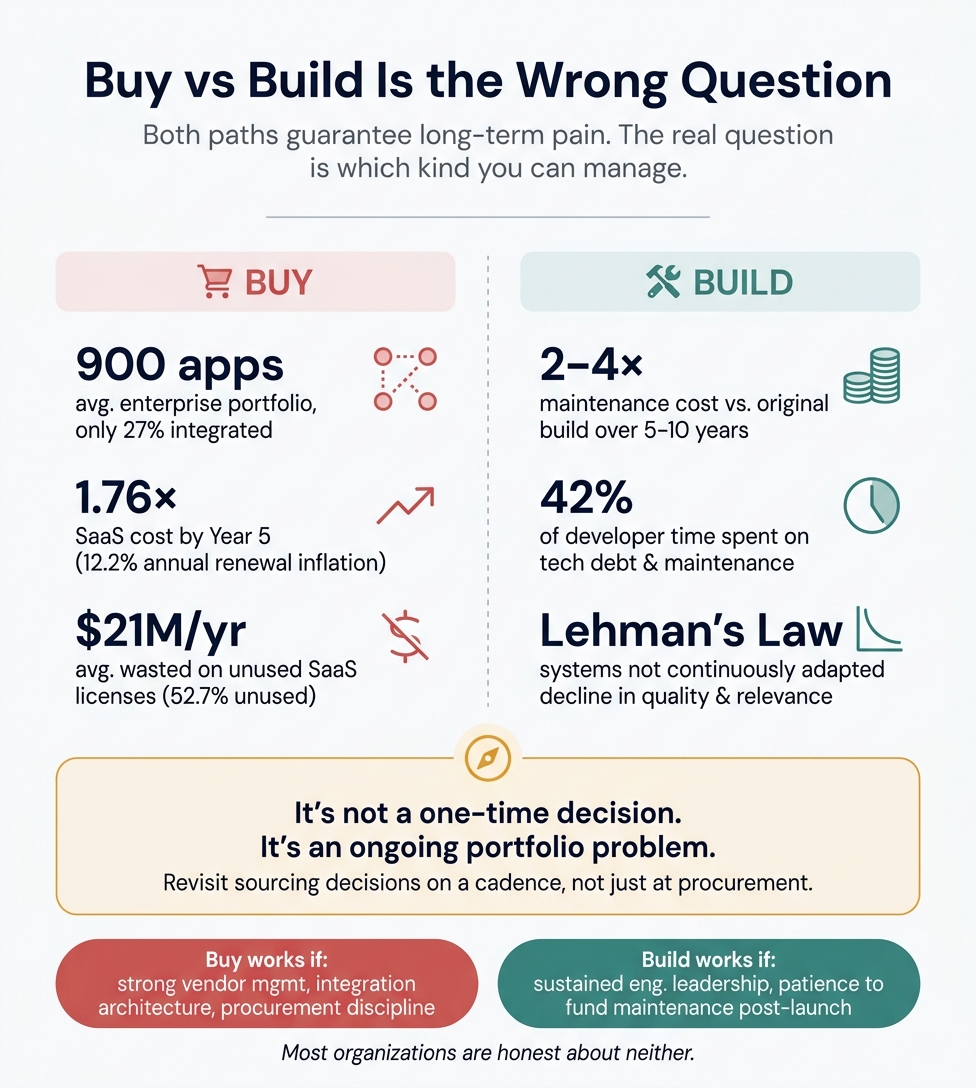
The framework treats the decision like a moment. In reality, it's the beginning of a long, slow accumulation of pain. The only question is which kind.
On the buy side, the pain is integration complexity. MuleSoft's 2025 data shows the average enterprise runs roughly 900 applications, and only 27% are integrated. IT teams spend 36 to 39% of their time on custom integration work. Every new SaaS tool widens the gap between what your systems know individually and what they can do together. Meanwhile, the Vertice SaaS Inflation Index recorded 12.2% annual renewal inflation in 2024, about 5x the G7 consumer price index. Your year one SaaS price is 1.76x by year five.
The waste is staggering. Zylo's 2025 data found 52.7% of provisioned SaaS licenses go unused, averaging $21M per organization in annual waste.
On the build side, the pain is just as persistent. The launch gets attention. The maintenance does not. Maintenance runs 40 to 80% of software lifecycle cost. Over a 5 to 10 year horizon, that's typically 2 to 4x the original development investment. Stripe's Developer Coefficient survey found developers spend about 42% of their week on tech debt and bad code.
The pattern is predictable. Leadership funds the build, celebrates the launch, then redirects engineering toward the next initiative. The system decays. Lehman's Laws of Software Evolution, established in 1980, formalized what practitioners already knew: systems that aren't continuously adapted decline in both quality and relevance.
The failure cases tell the same story from both directions. Lidl spent roughly €500M over seven years on a SAP implementation before abandoning it. Birmingham City Council's Oracle replacement started at £19M and has escalated past £144M. On the build side, HealthCare.gov grew from a $93.7M contract to $1.7B.
The frameworks that actually work treat this as portfolio management. Wardley Mapping plots components along an evolution axis, recognizing that today's custom differentiator becomes tomorrow's commodity. The sourcing decision that was right three years ago may be wrong today. The question needs revisiting on a cadence, not answering once at procurement.
So when someone asks "should we buy or build," I try to reframe. The real question is which type of long-term pain your organization is better equipped to manage. Do you have strong vendor management, procurement discipline, and integration architecture? You can absorb buy side complexity. Do you have sustained engineering leadership, platform product management, and institutional patience to fund maintenance long after launch? You can absorb build side decay.
Most organizations are honest about neither. That's where the frameworks fail. Not in the analysis, but in the assumption that the decision only needs to be made once.
Research brief: Why buy-vs-build frameworks fail as one-time decisions
This brief compiles data, frameworks, and case studies supporting the central argument that buy-vs-build is a portfolio problem, not a one-time choice. Bought solutions accrue integration debt at roughly 10–12% annual SaaS price inflation and sit in estates of 275–900 applications of which only ~27% are actually integrated. Built solutions consume 40–80% of lifecycle cost in maintenance and divert 10–20% of "new product" budgets to tech debt post-launch. Every major framework — Wardley Mapping, Gartner's Pace-Layered Strategy, Transaction Cost Economics, Prahalad–Hamel core competence — treats this as a continuous allocation across an evolving portfolio, yet most enterprises still decide as if procurement day is the only decision point. The remainder of this brief is organized to match the research requirements: TCO, SaaS sprawl, build-side decay, bought-side complexity, portfolio frameworks, failure cases, and a statistics cheat-sheet with source-quality flags.
1. TCO frameworks and why projections diverge from reality
Established frameworks. Gartner's TCO methodology originated in 1987 for PC lifecycle costing [1] and is codified in "Defining Gartner Total Cost of Ownership" (2005, Doc ID G00131837). Gartner's often-quoted claim that "purchase price is often just about 10 percent of the actual cost of implementation" [2] is widely cited but rarely sourced to a specific note. Forrester's Total Economic Impact™ (TEI) — developed by Giga and used by Forrester for 20+ years across 4,000+ case studies — adds two pillars beyond cost/benefit: Flexibility (real options) and Risk. [3] Most public TEI studies are vendor-commissioned (e.g., OutSystems 363% ROI, [4] Microsoft Dynamics $16.97 per $1), [5] so treat figures as directional. Nucleus Research's r208 (2020, 101 case studies) found "cloud technology deployments deliver 4.01 times the ROI as on-premises deployments" with payback 2.5× faster [6] — current but pre-SaaS-inflation-era data. Academic grounding sits in Boehm's COCOMO II (1995) [7] and its Annual Change Traffic maintenance model. [8]
Horizons and crossover points. Over a 5–10 year lifecycle, software maintenance typically costs 2–4× the original development investment, [9][10] with industry baselines of 15–25% of build cost per year, [11] rising to 40–60% per year in regulated sectors like healthcare [12] (HIPAA/HITRUST/SOC2 loading). ERP implementation services alone run 100–250% of software license cost [13] (Software Advice 2024). A widely-repeated but imperfectly sourced Gartner figure states license plus implementation is only ~15% of ERP TCO, with 85% ongoing [14] — treat as directional unless readers find the original note.
Why projections miss. The strongest modern evidence is Flyvbjerg, Budzier et al. (2022), "The Empirical Reality of IT Project Cost Overruns: Discovering A Power-Law Distribution," Journal of Management Information Systems 39(3), [15][16] n=5,392 projects. [17] IT cost overruns follow a power law, not a normal distribution, meaning conventional bottoms-up estimation systematically underprices tail risk. [18] Their 2011 HBR paper (n=1,471) found average 27% cost overrun but 1 in 6 projects was a "black swan" with 200% average overrun and ~70% schedule overrun. [19][20] The McKinsey–Oxford 2012 study of 5,400+ large IT projects remains the most-cited empirical benchmark: "Large IT projects run 45% over budget and 7% over time, while delivering 56% less value than predicted," [21] and 17% go so badly they threaten the company's existence. [22][23] Root causes map to Flyvbjerg's three drivers: optimism bias, uniqueness bias ("our project is different"), and strategic misrepresentation (advocates understating cost to secure funding). [24] Reference-class forecasting — endorsed by the American Planning Association (2005) [25] and UK Department for Transport (2004) [26] — is the methodologically credible antidote.
Hidden buy-side costs compound over multi-year horizons: automatic renewal escalators (typical 5–10%, [27] Salesforce contractually up to 7%), [28] feature deprecation forcing migration, admin/vendor-management overhead rarely counted (roughly 0.5–1 FTE per $1M of SaaS spend per practitioner benchmarks), customization drift that breaks on vendor updates, shelfware at 30%+ of fees per NPI Financial, exit/migration costs, compliance pass-through (BAAs, HITRUST), and data egress fees.
Hidden build-side costs: maintenance (perfective + corrective + adaptive + preventive), security patching cadence, on-call compensation (often 20–30% loading on engineering payroll), knowledge loss from attrition, compliance re-certification ($50k–$500k+ annually in regulated spaces), infrastructure scaling, and decommissioning (typically 10–20% of original build cost). Software engineer turnover at 23–25% annually, with replacement cost 100–250% of salary thehrdirector and 6-month ramp to full productivity, [29] creates a permanent productivity tax almost no TCO model captures.
2. SaaS sprawl, integration cost, and vendor-portfolio overhead
Average SaaS app counts vary dramatically by methodology — readers should know which number means what:
| Source (2024–2026) | Avg apps | What it measures |
|---|
| Okta Businesses at Work 2025 | 101 | Apps federated via Okta identity |
| BetterCloud State of SaaSOps 2025 | 106(down from 130 peak in 2022) | IT-pro survey, IT-visible apps |
| Zylo SaaS Management Index 2025 | 275Zylo(Enterprise 10K+:660)ZyloZylo | SMP data including shadow discovery |
| Zylo SMI 2026 | 305 | Same methodology, latest |
| MuleSoft Connectivity Benchmark 2025/26 | 897(with AI agents: 1,057–1,103) | All enterprise apps incl. on-prem/custom |
The frequently-cited "254 SaaS apps" figure is from Productiv's September 2021 State of SaaS Sprawl report — now four years old and often quoted as current. MuleSoft's 897 is not directly comparable to Okta's 101; it counts every enterprise application, not just SaaS.
Integration is the dominant unmet burden. MuleSoft's 2024–2026 benchmarks find only 27–28% of enterprise applications are integrated, [30][31] IT teams spend 36–39% of their time on custom integration work, [32] and 90% of IT leaders cite data silos as a top business barrier. [32][33] MuleSoft's 2023 report put average custom integration spend per organization at $4.7M. [34] Gartner sizes the iPaaS market at $8.5B in 2024 (+23.4% YoY), forecast to exceed $17B by 2028 [35] — integration tooling is the fastest-growing segment of application middleware. Gartner's global SaaS end-user spending forecast is $247.2B (2024, +20%) → ~$299B (2025, Gartner +19.2%), [36] inside worldwide IT spending of $6.08T in 2026 (+9.8%, Gartner first time above $6T).
SaaS price inflation has decoupled from general inflation. The Vertice SaaS Inflation Index recorded 12.2% annual SaaS renewal inflation in 2024 — the highest in the index and roughly 5× G7 CPI. [37][38] At 10% compounding escalators over a 5-year horizon, year-1 SaaS price becomes 1.61× at year 5; at 12% (Vertice's 2024 actual), 1.76×. SaaStr (2025) cites Gartner showing "corporate IT budgets are growing at just 2.8% annually, while SaaS vendors are hiking prices by 9–25%." [37]
Waste and duplication are now systemic. Zylo's 2025 SMI finds 52.7% of provisioned SaaS licenses go unused, averaging $21M per organization in annual license waste; [39][40] the 2026 SMI improves utilization to 54% with $19.8M waste. [41][42] The average enterprise carries 15 duplicate training apps, 11 project-management tools, and 10 team-collaboration apps [43] (Zylo 2024 SMI). [44] Gartner's most-quoted forward prediction: "Through 2027, organizations that fail to attain centralized visibility and coordinate SaaS life cycles will overspend on SaaS by at least 25%." [45][46]
Shadow IT quantifies the governance gap. Productiv finds ~48% of enterprise apps are unmanaged, [47][48] a figure that has held near half for three consecutive years. [48] Zylo's 2024 SMI is blunter: IT owns only 26.1% of SaaS spend and 15.9% of applications. [49] Gartner estimates shadow IT at 30–40% of IT spend in large enterprises [50] and projects the share of employees acquiring technology outside IT to rise from 41% (2022) to 75% (2027). [51][52] BetterCloud's 2021 report is the primary source for the often-cited claim that IT underestimates actual SaaS use by ~3×. [53][52]
A clean "integration as % of SaaS spend" headline does not exist in primary analyst sources. The Gartner iPaaS-to-SaaS ratio implies ~3.4% on tooling alone; adding MuleSoft's $4.7M/org custom integration plus professional services plausibly lifts the real integration burden into the 10–20% range, but no analyst publishes this as a single figure. Flag if cited.
3. Why built solutions lose sustained investment
Maintenance dominates lifecycle. The origin of the "80% maintenance" claim is Lientz, Swanson & Tompkins, Communications of the ACM, June 1978 — a pilot of 69 respondents, with the exact language "rough estimates… range as high as 75–80 percent." [54][55] The figure is a ceiling, not a mean, and the study is 47 years old. Glass's Facts and Fallacies of Software Engineering (2003) normalized it to "Maintenance typically consumes 40 to 80 percent of software costs," [56][57] with enhancements representing ~60% of maintenance work. [58] Capers Jones' 2008 US-industry data is the most recent widely-cited split: 28% new development, 42% enhancements, 30% maintenance [59] — meaning ~72% of engineering effort goes to existing systems. The "60/60 rule" [57] (O'Reilly, 97 Things Every Project Manager Should Know) consolidates this as 60% of lifecycle on maintenance, 60% of maintenance on enhancements. [58][57]
Stripe's Developer Coefficient (September 2018, Harris Poll, n>1,000 devs + >1,000 C-level) remains the most-cited modern figure, though pre-GenAI: developers spend 13.5 hrs/week on technical debt plus 3.8 hrs on bad code — 17.3 hrs total, or 42% of a 41-hour week. [60] Stripe valued the global drag at ~$85B/year on bad code and tech debt specifically [60] (the $300B and $3T figures sometimes quoted conflate broader opportunity cost). 52% of developers named legacy-system maintenance the top productivity hindrance — above leadership issues (45%) and custom tech (40%). Note: widely misquoted as "17 hours on bad code"; the correct breakdown is split between tech debt and bad code.
McKinsey's tech-debt research provides the most current leadership-oriented figures. The 2020 "Tech debt: Reclaiming tech equity" study (n=50 CIOs at >$1B financial services and tech firms) [61][62] found tech debt represents 20–40% of the value of the entire technology estate before depreciation, [63][62] 10–20% of new-product budgets are diverted to resolving tech debt, [63] and 60% of CIOs reported tech debt rising over the prior three years. [63][62] The 2023 follow-up ("Breaking technical debt's vicious cycle") adds that companies managing tech debt free up to 50% more engineer time for value-generating work, [60][64] and bottom-quintile tech-debt firms are 40% more likely to have incomplete or canceled modernizations. Flag: small, narrow sample; CIO self-estimates, not audited.
Theoretical backbone for degradation. Lehman's Laws of Software Evolution (1980) establish that E-type systems must continually adapt (Law I), increase in complexity unless actively reduced (Law II), [65] and are perceived as declining in quality without rigorous maintenance (Law VII). [66] Ward Cunningham's 1992 technical-debt metaphor (OOPSLA '92) warned that "entire engineering organizations can be brought to a stand-still under the debt load of an unconsolidated implementation." [67] Fred Brooks' Second-System Effect (The Mythical Man-Month, 1975) captures the rewrite trap: "This second is the most dangerous system a man ever designs." [68] Joel Spolsky's 2000 "Things You Should Never Do, Part I" documents Netscape 6.0's three-year rewrite contributing to its collapse. [69]
Leadership-attention and platform dynamics are best supported by practitioner writing rather than statistics. Will Larson (lethain.com) argues that "migrations are usually the only available avenue to make meaningful progress on technical debt" [70] and warns of a failure mode where "companies missing a structured investment thesis for their internal platforms [create] rent-seeking behaviors, even though everyone involved is attempting to rationally maximize their impact." [71] He recommends an explicit split — e.g., 50% core business, 30% new product, 20% platform quality [71] — plus a platform-to-product engineer ratio (his example: 4:1). [72] Camille Fournier's "Product for Internal Platforms" (2020) identifies "software that is building to be built" [73] — internal systems built because engineers want to build them, not because of validated user demand — as a recurring pattern; [74] without product-management discipline, captive internal audiences mask failure. [73] Her 2024 O'Reilly book with Ian Nowland, Platform Engineering, [75] codifies the argument that internal platforms must be run as products with earned, not mandated, adoption. [75][76]
Bus-factor / key-person risk. Izquierdo-Cortazar et al.'s HICSS 2009 "software archaeology" research introduced "orphaned code" [77] as a measurable construct and found in FLOSS data that new contributors take ~30 months on average to reach core-productivity on an existing system [78] — implying senior-developer departures impose multi-year institutional costs. Google's 2023 tech-debt research (Jaspan & Green, IEEE Software), based on 5 years of quarterly engineering surveys, identified 10 tech-debt categories; "migration is needed or in progress" was the top-ranked productivity hindrance, [79] and of 117 candidate objective metrics, most were weak predictors [80] — reinforcing that tech debt is largely experiential and hard to measure from telemetry alone.
4. Why bought solutions accrue complexity
Integration debt is the dominant lock-in mechanism, not contracts. IDC data cited in practitioner literature finds enterprises with 10+ Salesforce integrations show 40% lower churn [81] — integration breadth, not functional fit, is what makes switching painful. Gartner's 2022 retention research (as cited via Monetizely) found 58% of customers who feel "trapped" eventually leave despite switching costs and become detractors [81] — meaning lock-in converts to attrition plus reputational damage, not durable retention. Deloitte Tech Trends 2023 reports 74% of SaaS buyers now evaluate switching costs before purchase, up from 47% in 2018. [81] The Broadcom–VMware relicensing shock (2023–2024) is the most recent real-world stress test: customers who had pre-documented export timelines and parallel-run clauses negotiated materially better outcomes. [82]
Configuration debt is the quiet killer of packaged software. The Salesforce "clicks-not-code" pattern is widely documented across practitioner literature (Gearset, Sweep, Prodly, Foundhq): overlapping Process Builders + Flows + triggers creating recursive loops; [83][84] duplicated approval processes and email templates; [85] hundreds of unused custom fields; [83][86] "configuration drift" between sandbox and production as the leading deployment failure cause. [87] Salesforce's retirement of Workflow Rules and Process Builder [83] turned prior configuration choices into active migration liabilities, illustrating the vendor-driven upgrade burden.
Panorama Consulting's ERP data (annual reports, 2024–2026) finds ~64% of ERP projects exceed budget, only ~49% go live on schedule, and 51% experience material operational disruptions Kpcteam at go-live. The leading 2026 overrun driver is "additional technology needs" — the classic pattern where a misfit is discovered late [88] and a custom build appears inside the bought stack.
Healthtech-specific buy complexity. KLAS 2024/2025 data shows Epic holds ~36–42% of acute-care hospitals and ~54.9% of hospital beds; Oracle/Cerner 22.9–25%. [89] Practitioner estimates for Epic interface costs: **$15,000–$20,000 per basic interface standup, $3,000–$15,000 per interface per year to maintain** [90] (Tactionsoft 2026). Read-only FHIR integration of Patient + Condition is "straightforward"; adding MedicationRequest, Procedure, DocumentReference, and Observation roughly doubles effort, and write-back is materially harder. [90] A JMIR case study (2021, 5 US academic medical centers) found integrating a single third-party decision aid into Epic took 18 months and a 6-step process across all five sites. [91] KLAS 2023: 37% of healthcare executives cite inadequate EHR-to-EHR integration as a cause of care delays. [92] Priestman et al. (Int J Med Inform 2021) report that 5 years after Epic's Danish Sundhedsplatformen go-live, 32% of users remained dissatisfied or very dissatisfied; [93] Finland's Apotti saw only 4.7% of physicians and 7.3% of nurses agree patient information was easy to access [93] post-Epic versus the prior system.
API versioning burden is escalating. Microsoft is retiring Azure API for FHIR on September 30, 2026 (no new deployments after April 1, 2025), [94] forcing migration to Azure Health Data Services and deprecating Sync Agent, FHIR Proxy, and SMART on FHIR proxy along the way. [95] HL7 FHIR has moved DSTU2 (2015) → STU3 (2017) → R4 (2019) → R5 (2023) → R6 in ballot; formal HL7 policy makes deprecated artifacts withdrawal-eligible two years after deprecation publication. [96] CMS patient-access, payer API, and prior-authorization rules all hit hard deadlines by January 1, 2027, [97] effectively mandating FHIR R4 on plans and providers whose current integrations are HL7v2 point-to-point. Aggregate migration cost figures are not peer-reviewed but HIMSS commentary describes this as the largest healthcare API rework since Meaningful Use.
5. Portfolio-level thinking: frameworks that already exist
Every major framework agrees buy-vs-build is a continuous allocation against an evolving portfolio — yet most enterprises still treat it as a procurement-cycle event.
Gartner's Pace-Layered Application Strategy (2010) segments the application estate into three layers with different sourcing, life cycles, and governance: [98]
| Layer | Life cycle | Sourcing | Governance |
|---|
| Systems of Record | 10+ years | Buy / packaged | Waterfall, heavy change control |
| Systems of Differentiation | 1–3 years | Buy + heavily configure or best-of-breed | Incremental, business-engaged |
| Systems of Innovation | 0–12 months | Build, often with departmental resources | Agile, iterative |
Specific numeric allocations across the three layers (e.g., "70/20/10") appear in consultancy writeups, [99] not in Gartner's primary note — flag if cited.
Simon Wardley's Mapping makes the portfolio dimension explicit via the evolution axis: Genesis → Custom Built → Product → Commodity. [100] Components move left-to-right under competitive pressure, so today's custom-built differentiator becomes tomorrow's product and eventually a commodity. [101][102] Wardley's core warning in "Pitfalls of outsourcing" (2008): functional outsourcing bundles genesis, custom, and commodity activities into a single contract, [103] producing "loss of innovative activities, potential future profits, capability and talent" [103] plus "lock-in and cost overruns." [103] His doctrine (2016): "The issue with outsourcing isn't that the concept is wrong but instead that we have a tendency to outsource entire systems for which we do not understand the landscape." [104] A healthy portfolio has components being built, bought, and outsourced simultaneously with matched team types (Pioneers / Settlers / Town Planners).
Transaction Cost Economics (Coase 1937, Williamson 1975/1985) predicts build when asset specificity is high — software that embeds firm-specific process or data. Williamson's bilateral dependency / hold-up risk is the formal statement of vendor lock-in. [105] Geyskens, Steenkamp & Kumar's 2006 Academy of Management Journal meta-analysis "Make, Buy, or Ally" found strong empirical support for TCE in both make/buy and ally/buy decisions, with uncertainty often as predictive as asset specificity. [106]
Prahalad & Hamel, "The Core Competence of the Corporation" (HBR, May 1990) frames the firm as "a portfolio of competencies, instead of a portfolio of strategic business units" [107] — build those competencies that open markets, contribute customer benefit, and are hard to imitate. Joel Spolsky's 2001 "In Defense of Not-Invented-Here Syndrome" is the most-quoted engineering-leader codification: "If it's a core business function — do it yourself, no matter what." [108][109]
Martin Fowler's Utility-vs-Strategic Dichotomy captures the dynamic directly: "This is not a static dichotomy. Business activities that are strategic can become a utility as time passes. Less often, a utility can become strategic if a company figures out how to make that activity a differentiator." [110] ThoughtWorks Technology Radar's "Bounded Buy" is the operational guardrail: "Only select vendor products that are modular and decoupled and can be contained within the Bounded Context of a single business capability" [111] — explicitly designed to preserve reversibility.
Will Larson's framework (lethain.com, 2020) treats buy-vs-build as a function of Risk, Value, and Cost with four cost components: integration, financial, operating, and evolution costs — how needs shift over time. Key quotes: "Using a vendor is taking on an outstanding debt"; "Many companies are quite bad at vendor management and are quite good at building things. As such, their calculations always show that vendors are worse than building it themselves"; and the Uber example — they built replacements for Greenhouse and Zendesk only at ~2,000 engineers, relying on vendors extensively until that scale threshold. Camille Fournier is explicit on the portfolio angle: "You should expect that the decision of where to build or buy will change over the years… especially for software that is not core to your business, try to build the minimal set so that you can migrate to better options if and when they appear." Charity Majors (Honeycomb CTO) makes the inverse argument for observability-as-core — build when observability is your core, buy otherwise.
Reversibility — Bezos's Type 1 / Type 2 decisions (Amazon 2015/2016 shareholder letters) applies directly: buy decisions appear Type 2 (reversible) but become Type 1 via asset-specific integration debt; build decisions are Type 1 at commit but can become Type 2 at year 5+ if the abstraction is preserved.
Practitioner consensus that the dichotomy itself is false is emerging across several voices. Moody's Omar Khan (2024): "In practice, it is increasingly a false dichotomy. The more productive question is: build what, buy what, and how do you connect them?" Kyle Gabriel: "Everything 'bought' requires integration, and it is building of that integration that actually builds the value to your organization." The actual spectrum runs: pure buy → buy + configure → buy + integrate (bounded buy) → build on bought platform/OSS → build on internal platform → build from scratch.
6. Failure cases supporting the thesis
Bought-side integration nightmares. Lidl spent ~€500M over seven years (2011–2018) on SAP eLWIS before abandoning to legacy Wawi — rooted in insistence on customizing SAP to preserve non-standard inventory accounting. Birmingham City Council's Oracle Fusion replacement started at £19M (2021) and has escalated to £144.4M (Jan 2026), projected to £216.5M by April 2026 by the Sheffield Audit Reform Lab, having contributed to the council's Section 114 bankruptcy notice; it is now being re-implemented "out-of-the-box" from scratch. Revlon's 2018 SAP S/4HANA go-live caused inability to fulfill ~$64M of Q1 shipments, Q4 net loss of $70.3M, and three shareholder class actions. National Grid's 2012 SAP go-live during Hurricane Sandy produced $8M in unrecovered overpayments, 15,000+ unprocessed vendor invoices, and escalated to $383M project cost plus $585M remediation against a $260M baseline; a 2017 lawsuit against Wipro followed. Target Canada rushed SAP across 133 stores in ~2 years against recommended 3–5, producing empty shelves and overflowing DCs, bankruptcy protection in January 2015, and ~$7B parent losses. Hershey's 1999 SAP + Manugistics + Siebel concurrent implementation compressed to 30 months from recommended 48 cost ~$112M and ~$100M in unshipped Halloween/Christmas orders. The UK NHS National Programme for IT (NPfIT, 2002–2011) was called by the Public Accounts Committee "one of the worst and most expensive contracting fiascos ever," with initial budget £6.2B, estimated final ~£10B+, and delivered benefits to March 2012 of only £3.7B — half the incurred cost. Somerset County Council's Southwest One JV with IBM promised ~£200M savings and produced £3.3M by 2011 before litigation; Surrey County Council's SAP → Unit4 migration came in £27.9M vs £16.6M budget (68% overrun) with 18-month slippage and payroll failures affecting teachers.
Built-side liabilities. HealthCare.gov's October 2013 launch grew from a $93.7M CGI Federal contract to an HHS OIG total of $1.7B, with 45 critical and 324 serious defects identified a month pre-launch (GAO); the failure triggered the creation of USDS and 18F. UK Universal Credit (DWP) has written off £34M, admitted £40M losses with further £91M written down, and by March 2018 had spent £1.3B on digital services much of which was to be decommissioned in July 2019 and not reused — the NAO flagged a "good news culture" and mismanaged agile adoption. Exclaimer's 2025 survey (n≈2,000 IT/security decision-makers) reports 71% of in-house builds are eventually abandoned — flag as vendor-sponsored, directional only. Flyvbjerg/Budzier (HBR 2011) cites Kmart's IT modernization growing from $1.4B to $2B and contributing to bankruptcy, Levi Strauss's SAP growing from a $5M original scope to $192M per the HBR dataset, and Hong Kong airport's $600M IT losses.
7. Statistics cheat-sheet with source-quality flags
High-confidence numbers defensible for a CTO-level audience:
| Statistic | Source | Year |
|---|
| Large IT projects: 45% over budget, 56% less value, 17% threaten the company | McKinsey–Oxford (5,400 projects) | 2012 |
| IT cost overruns follow a power-law distribution | Flyvbjerg et al., JMIS (5,392 projects) | 2022 |
| 1 in 6 IT projects is a Black Swan with 200% average overrun | Flyvbjerg & Budzier, HBR (1,471 projects) | 2011 |
| Maintenance = 40–80% of software lifecycle cost | Glass, Lientz–Swanson lineage | 1978/2003 |
| Maintenance = 2–4× original development over 5–10 years | Boehm/COCOMO consensus | ongoing |
| Developers spend 17.3 hrs/week (42%) on tech debt + bad code | Stripe Developer Coefficient (n>2,000) | 2018 |
| Tech debt = 20–40% of tech estate value | McKinsey (n=50 CIOs, financial/tech >$1B) | 2020 |
| 10–20% of new-product budgets diverted to tech debt | McKinsey | 2020 |
| Tech debt management frees up to 50% more engineer time | McKinsey | 2023 |
| Enterprise avg 275 SaaS apps (660 at 10K+ employees) | Zylo SMI | 2025 |
| Enterprise avg 897 total apps, only 27% integrated | MuleSoft Connectivity Benchmark | 2025 |
| IT spends 36–39% of time on custom integration | MuleSoft | 2025 |
| 52.7% of SaaS licenses unused = $21M avg waste/org | Zylo SMI | 2025 |
| SaaS renewal inflation 12.2% (~5× G7 CPI) | Vertice SaaS Inflation Index | 2024 |
| Gartner SaaS spend forecast ~$299B | Gartner | 2025 |
| iPaaS market $8.5B (2024) → >$17B (2028) | Gartner | 2024 |
| Orgs will overspend SaaS by ≥25% without centralized management | Gartner prediction through 2027 | 2024 |
| Shadow IT = 30–40% of IT spend | Gartner (widely cited) | ongoing |
| 48% of enterprise apps unmanaged | Productiv State of SaaS | 2024 |
| IT underestimates SaaS by ~3× (apps) / 304% (spend) | BetterCloud 2021 / Zylo 2024 | 2021/24 |
| Epic covers ~54.9% of US hospital beds | KLAS | 2024 |
| 64% of ERP projects over budget; 51% disrupted at go-live | Panorama Consulting ERP Report | 2024–26 |
| Healthcare leads all sectors at $9,100–10,150 SaaS/employee | Vertice | 2025 |
| 30% of SaaS fees attributable to unused licenses | NPI Financial | 2024 |
Flag-for-caution numbers: the "254 SaaS apps" figure (Productiv 2021, often quoted as current); the "80% of software cost is maintenance" claim (Lientz–Swanson 1978 ceiling from a 69-org pilot); the Exclaimer "71% of in-house builds abandoned" (vendor-sponsored survey); various "Gartner says" claims on ERP TCO splits and shadow-IT percentages that circulate without a specific note ID; Gartner pace-layered allocations like "70/20/10" that appear in consultancy writeups but not Gartner's primary text; Monetizely-cited IDC/Gartner numbers whose paywalled originals could not be directly verified; "Gartner 2025 SaaS Economics report: hidden costs add 150–200%" — cited in blog posts but the primary Gartner report title could not be located.
Gaps in the available evidence: a clean primary-source figure for "integration as % of SaaS spend" (implied 10–20% from combining iPaaS market + custom integration labor + professional services, but not published as a headline); rigorous mean lifespan of internal tools before becoming "legacy" (anecdotal 2–5 year cycles from Fournier/Larson); aggregate migration cost for the 2027 CMS-driven FHIR R4 rework; "FTE per vendor" overhead figures from primary analysts.
8. Conclusion: what the evidence changes
The underlying data supports a stronger thesis than "buy or build has tradeoffs." Buy economics are now visibly deteriorating in long-horizon terms — 12% compound renewal inflation, 275+ app portfolios with 27% integration coverage, $21M per-organization annual license waste, and Gartner's own prediction of ≥25% overspend through 2027 without centralized SaaS management. Build economics have a 45-year-old, remarkably stable ceiling — maintenance at 40–80% of lifecycle cost, 2–4× original development over 5–10 years, 42% of developer weeks on tech debt and bad code, and 20–40% of technology-estate value locked in debt. The gap is not which path is cheaper; it is which failure mode your organization has built the organizational capability to manage. Wardley's evolution axis, Gartner's pace layers, and Williamson's asset specificity all point to the same conclusion: the optimal sourcing choice for any given component changes over time, and organizations that revisit the portfolio on a cadence outperform those that decide once at procurement. The strongest framing for a CTO audience is that buy-vs-build is not a question answered by a framework at all — it is a question answered by whether the organization has the capability stack (vendor management, platform engineering, SRE, product management for internal tools, reference-class forecasting discipline) to continuously re-answer it.
- Rocketech — https://rocketech.it/blog/post/total-cost-of-ownership-the-hidden-expenses-and-how-to-calculate-them
- Simplesolve — https://www.simplesolve.com/blog/pc-system-tco-factors-in-figuring-this-metric
- Forrester — https://www.forrester.com/policies/tei/
- OutSystems — https://www.outsystems.com/1/low-code-roi-tei/
- Microsoft — https://info.microsoft.com/ww-landing-Nucleus-Research-ROI-Report-ebook.html?LCID=EN-US
- Oracle — https://www.oracle.com/a/ocom/docs/applications/erp/nucleus-research-cloud-delivers-4point01-times-the-roi-as-on-premises.pdf
- Springer — https://link.springer.com/article/10.1007/BF02249046
- Geektonight — https://www.geektonight.com/software-maintenance-software-engineering/
- ADEVS — https://adevs.com/blog/software-maintenance-costs/
- EduBirdie — https://edubirdie.com/docs/university-of-alberta/cmput301-intro-to-software-engineering/94866-software-maintenance-process-models
- 6amTech — https://6amtech.com/blog/tips-to-reduce-software-maintenance-cost/
- Abbacus Technologies — https://www.abbacustechnologies.com/software-maintenance-cost-how-much-does-it-really-cost/
- Software Advice — https://www.softwareadvice.com/resources/erp-implementation-cost-calculator/
- LinkedIn — https://www.linkedin.com/pulse/erp-total-cost-ownership-what-you-need-know-seidor-mena
- Itu — https://pure.itu.dk/en/publications/the-empirical-reality-of-it-project-cost-overrun-discovering-a-po/
- ResearchGate — https://www.researchgate.net/publication/364162898_The_Empirical_Reality_of_IT_Project_Cost_Overruns_Discovering_A_Power-Law_Distribution
- Google Scholar — https://scholar.google.com/scholar_lookup?title=The+empirical+reality+of+IT+project+cost+overruns:+Discovering+A+power-law+distribution&=&author=B.+Flyvbjerg&=&author=A.+Budzier&=&author=J.+S.+Lee&=&author=M.+Keil&=&author=D.+Lunn&=&author=D.+W.+Bester&=&publication_year=2022&=&journal=Journal+of+Management+Information+Systems&=&pages=607-639&=&doi=10.1080/07421222.2022.2096544
- SSRN — https://papers.ssrn.com/sol3/papers.cfm?abstract_id=4204819
- SSRN — https://papers.ssrn.com/sol3/papers.cfm?abstract_id=2229735
- Pemeco Consulting — https://pemeco.com/drive-erp-success-and-avoid-black-swan-implementation-failures/
- Neontri — https://neontri.com/blog/build-vs-buy-software/
- Faeth Coaching — https://faethcoaching.com/it-project-failure-rates-facts-and-reasons/
- Neocode — https://www.neocode.com/blog/research-summary-delivering-large-scale-it-projects-on-time-on-budget-and-on-value-by-michael-bloch-sven-blumberg-jurgen-laartz-mckinsey-company-2012/
- Taylor & Francis Online — https://www.tandfonline.com/doi/full/10.1080/09537287.2025.2578708
- PMI — https://www.pmi.org/learning/library/nobel-project-management-reference-class-forecasting-8068
- Wikipedia — https://en.wikipedia.org/wiki/Reference_class_forecasting
- medium — https://blossomstreetventures.medium.com/maintaining-net-dollar-retention-over-100-is-critical-to-the-health-of-your-saas-business-and-26141568fb5c
- Lighter Capital — https://www.lightercapital.com/blog/when-and-how-often-to-raise-saas-prices
- thehrdirector — https://www.thehrdirector.com/?p=140871
- MuleSoft Blog — https://blogs.mulesoft.com/agentic-perspectives/connectivity-benchmark-report/
- Integrate.io — https://www.integrate.io/blog/data-integration-adoption-rates-enterprises/
- Salesforce — https://www.salesforce.com/news/stories/connectivity-report-announcement-2025/
- Salesforce — https://www.salesforce.com/blog/mulesoft-connectivity-benchmark-2025/
- ITPro Today — https://www.itprotoday.com/it-operations/mulesoft-connectivity-benchmark-report-details-integration-challenges
- Informatica — https://www.informatica.com/about-us/news/news-releases/2025/05/20250522-informatica-named-a-leader-in-the-2025-gartner-magic-quadrant-for-ipaas.html
- CloudZero +2 — https://www.cloudzero.com/blog/saas-statistics/
- SaaStr — https://www.saastr.com/the-great-price-surge-of-2025-a-comprehensive-breakdown-of-pricing-increases-and-the-issues-they-have-created-for-all-of-us/
- Vertice — https://www.vertice.one/l/saas-inflation-index-report
- Mi3 — https://www.mi-3.com.au/17-01-2025/licence-spill-multimillion-dollars-saas-wasteland-cmos-can-not-afford-ignore
- Zylo — https://zylo.com/reports/2025-saas-management-index/
- Zylo — https://zylo.com/blog/saas-statistics/
- Zylo — https://zylo.com/blog/top-saas-management-it-metrics-to-watch/
- Zylo — https://zylo.com/blog/zylo-named-a-leader-gartner-magic-quadrant-for-saas-management-platforms/
- PR Newswire — https://www.prnewswire.com/news-releases/2024-saas-management-index-reveals-an-average-of-18m-in-annual-license-waste-with-significant-security-risks-from-employee-expensed-apps-302071679.html
- Zylo — https://zylo.com/blog/better-buyer-saas-pricing/
- Flexera — https://www.flexera.com/blog/saas-management/flexera-recognized-in-the-latest-2024-gartner-magic-quadrant-for-saas-management-platforms/
- SellersCommerce — https://www.sellerscommerce.com/blog/saas-statistics/
- Productiv — https://productiv.com/blog/saas-statistics-that-every-it-manager-should-see/
- Zylo — https://zylo.com/2024-saas-management-index/
- JumpCloud +2 — https://jumpcloud.com/blog/shadow-it
- BetterCloud — https://www.bettercloud.com/monitor/saas-statistics/
- Auvik — https://www.auvik.com/franklyit/blog/shadow-it-stats/
- Zylo — https://zylo.com/blog/zylo-2024-wrapped/
- ACM Digital Library — https://dl.acm.org/doi/10.1145/359511.359522
- ResearchGate — https://www.researchgate.net/publication/225070557_Characteristics_of_Application_Software_Maintenance
- ResearchGate — https://www.researchgate.net/figure/The-software-life-cycle-Maintenance-is-the-dominant-cost-component_fig2_225747069
- O'Reilly — https://www.oreilly.com/library/view/97-things-every/9780596805425/ch34.html
- Ventionteams +4 — https://ventionteams.com/enterprise/software-maintenance-costs
- Slidetodoc — https://slidetodoc.com/capers-jones-associates-llc-software-sizing-and-cost/
- Tiny — https://www.tiny.cloud/technical-debt-whitepaper/
- mckinsey — https://mckinsey.com/~/media/McKinsey/Business%20Functions/McKinsey%20Digital/Our%20Insights/Tech%20Debt%20Reclaiming%20tech%20equity/Tech-Debt-Reclaiming-tech-equity.pdf
- McKinsey & Company — https://www.mckinsey.com/capabilities/mckinsey-digital/our-insights/tech-debt-reclaiming-tech-equity
- medium — https://medium.com/digital-mckinsey/tech-debt-its-role-in-reclaiming-your-organization-s-tech-equity-4479ee346f1b
- McKinsey & Company — https://www.mckinsey.com/capabilities/tech-and-ai/our-insights/breaking-technical-debts-vicious-cycle-to-modernize-your-business
- LinkedIn — https://www.linkedin.com/learning/migrating-cobol-apps/lehman-s-laws-of-software-evolution
- Grokipedia — https://grokipedia.com/page/Lehman's_laws_of_software_evolution
- Wikipedia — https://en.wikipedia.org/wiki/Technical_debt
- Wikiquote — https://en.wikiquote.org/wiki/Fred_Brooks
- Bssw — https://bssw.io/items/things-you-should-never-do-part-i
- Lethain — https://lethain.com/migration-isnt-failing-due-to-lack-of-staffing/
- Lethain — https://lethain.com/platform-product-fit/
- Lethain — https://lethain.com/eng-strategies/
- Medium — https://skamille.medium.com/product-for-internal-platforms-9205c3a08142
- InfoQ — https://www.infoq.com/news/2020/08/fournier-internal-platform/
- Goodreads — https://goodreads.com/book/show/217312157.Platform_Engineering_A_Guide_for_Technical__Product__and_People_Leaders
- Alex Navasardyan — https://www.alex.social/platform-engineering-by-camille-fournier-and-ian-nowland/
- flosshub — https://flosshub.org/node/1265
- docslib — https://docslib.org/doc/4678474/using-software-archaeology-to-measure-knowledge-loss-in-software-projects-due-to-developer-turnover
- LinkedIn — https://www.linkedin.com/pulse/how-google-measures-manages-tech-debt-abi-noda
- Ombulabs — https://www.ombulabs.ai/blog/tech-debt-maturity-model.html
- Getmonetizely — https://www.getmonetizely.com/articles/pricing-for-lock-in-creating-strategic-switching-costs-in-saas
- IT Asset Management — https://itassetmanagement.net/2026/02/23/vendor-lock-in-a-beginners-guide/
- DEV Community — https://dev.to/sumeetsrivastava/how-to-reduce-technical-debt-in-a-legacy-salesforce-org-a-practical-audit-guide-11e3
- Prodly — https://www.prodly.co/blog/managing-technical-debt-salesforce
- Gearset — https://gearset.com/blog/managing-salesforce-technical-debt/
- Gearset — https://gearset.com/blog/what-is-salesforce-technical-debt/
- Sweep — https://www.sweep.io/blog/5-tools-to-help-you-manage-salesforce-tech-debt/
- Panorama-consulting — https://www.panorama-consulting.com/panorama-consulting-group-releases-latest-study-of-erp-implementation-outcomes-across-the-globe/
- IntuitionLabs — https://intuitionlabs.ai/articles/epic-vs-cerner-ai-comparison
- Taction Soft — https://www.tactionsoft.com/ehr-integration-cost-guide/
- JMIR — https://www.jmir.org/2021/5/e22766
- Vorro — https://vorro.net/how-to-achieve-watertight-ehr-integration-with-epic-and-cerner/
- ScienceDirect — https://www.sciencedirect.com/science/article/abs/pii/S1386505621000204
- Microsoft Learn — https://learn.microsoft.com/en-us/azure/healthcare-apis/azure-api-for-fhir/release-notes
- Microsoft Learn — https://learn.microsoft.com/en-us/azure/healthcare-apis/fhir/migration-strategies
- FHIR — https://build.fhir.org/versions.html
- Vorro — https://vorro.net/future-of-fhir-api-healthcare-interoperability/
- Slideshare — https://www.slideshare.net/slideshow/documensitesd08-2pdf/259096015
- LinkedIn — https://www.linkedin.com/pulse/shorticle-332-gartners-pace-layered-application-dr-magesh-kasthuri
- Wikipedia — https://en.wikipedia.org/wiki/Wardley_map
- Stratrix — https://www.stratrix.com/learn/frameworks/wardley-mapping
- Medium — https://medium.com/code-for-america/the-tyranny-of-agile-4e406c1da7fa
- Gardeviance — https://blog.gardeviance.org/2008/02/pitfalls-of-outsourcing.html
- Gardeviance — https://blog.gardeviance.org/2016/08/doctrine.html
- economicsonline — https://www.economicsonline.co.uk/business_economics/make-or-buy-in-software-the-boundaries-of-the-firm-through-transaction-cost-economics.html/amp
- Academy of Management Journal — https://journals.aom.org/doi/10.5465/amj.2006.21794670
- SSRN — https://papers.ssrn.com/sol3/papers.cfm?abstract_id=1505251
- DEV Community — https://dev.to/scottshipp/comment/ino8
- joelonsoftware — https://www.joelonsoftware.com/2001/10/14/in-defense-of-not-invented-here-syndrome/
- Martin Fowler — https://martinfowler.com/bliki/UtilityVsStrategicDichotomy.html
- Thoughtworks — https://www.thoughtworks.com/en-gb/radar/techniques/bounded-buy
Commissioned from our research desk. Subject to final editorial discretion.