The proof is indisputable.
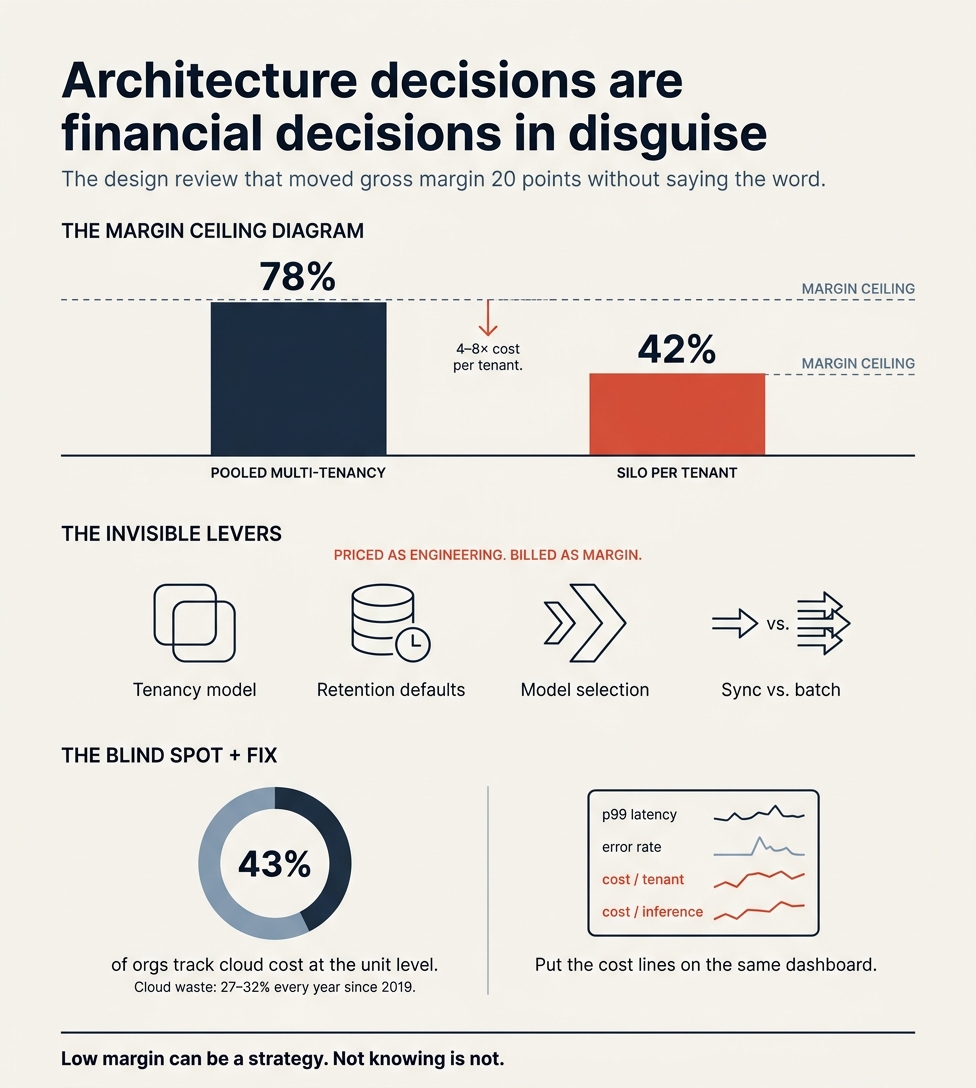
In a design review last spring, we spent forty minutes on p99 latency and nine seconds on the decision to give every customer their own isolated stack. Nobody was being careless. Isolation is easier to reason about, the compliance conversation gets shorter, blast radius shrinks. But we had just moved our gross margin ceiling by twenty points, and nobody said the word margin.
Architecture decisions are financial decisions wearing engineering clothes, and we almost never label them that way when we make them.
The examples are not exotic. Pooled multi-tenancy runs four to eight times cheaper than a silo per tenant, the difference between 78% gross margin and 42%. Cross availability zone traffic bills a penny per gigabyte each direction, so your HA design charges twice for the same byte, and data transfer never appears on an architecture diagram. Log retention at ninety days because that was the dropdown value. Synchronous processing for a job no human is waiting on when the batch API costs half. Model selection where the spread between cheap and frontier, same task, runs 5x or several hundred times.
None of those were framed as pricing decisions. All of them are.
The uncomfortable part: Flexera puts organizations tracking cloud cost at the unit level at about 43%, and cloud waste has sat between 27% and 32% every year since 2019, ticking up recently because of AI. Most engineering orgs make margin decisions weekly while structurally unable to see the number they are moving. And the multi-tenant architecture that produces good margins is the one that makes per customer cost hardest to attribute, because the bill tells you what was consumed, not by whom.
AI made this urgent rather than academic. Traditional SaaS lived in the 70 to 80% range. ICONIQ has AI product gross margins at 41% in 2024, 45% in 2025, 52% projected for 2026. Improving, still structurally below software. Inference prices fall roughly tenfold a year for equivalent capability and total bills keep rising anyway, because agentic workflows turn one click into fifteen model calls. Cursor learned this in public when a flat seat price met users burning billions of tokens. Intercom priced Fin at ninety nine cents per resolution, what it looks like when pricing and architecture are designed by people who talk to each other.
a16z has argued convincingly that thin early margins are not automatically a broken business, and premature cost optimization can wreck reliability and velocity. Low margin can be a deliberate strategy. Not knowing is not a strategy.
Put cost per tenant and cost per inference on the same dashboard as error rate and p99, give features a cost budget the way you give them a latency SLO, and let the engineer setting the retention default see what it costs.
Otherwise you designed your pricing and your architecture in separate rooms, and only one of them decides what your margin can be.
How architecture decisions set the ceiling on gross margin (and why engineering rarely sees the number)
TL;DR
- Gross margin is largely pre-decided at the architecture layer: multi-tenancy model, storage tiering and retention, model selection and routing, sync vs batch processing, over-provisioning, data transfer topology, observability retention and database/caching choices all set the unit cost per customer, per transaction and per inference, yet almost none of these are framed as financial decisions when they are made.
- The disconnect is measurable: only 43% of organisations track cloud cost at the unit level (Flexera 2025), 89% say lack of cost visibility hurts their ability to do their job (CloudZero 2024), cloud waste has been stuck at 27-32% since 2019, and every 5 points of gross margin is worth roughly 1-2x of revenue multiple (SaaS Capital); so architecture choices quietly move enterprise value.
- AI has broken the 80% SaaS benchmark: AI product gross margins now run 50-60% (ICONIQ projects 52% for 2026, up from 41% in 2024), inference costs fall about 10x a year yet total bills keep rising (Jevons paradox), and companies from Cursor to Dropbox are visibly repricing or re-architecting around COGS.
Key findings (hardest numbers first)
SaaS gross margin benchmarks
- Median total gross margin for private SaaS is 71-75% (2024 KeyBanc Capital Markets and Sapphire Ventures SaaS Survey); subscription-only gross margin median about 79%. Below 70% is widely treated as a structural problem.
- Pure self-serve/PLG software hits 80-85% or more; companies bundling significant services or support land at 60-70%.
- SaaS Capital 2026 spending benchmarks: hosting is a median of 5% of ARR; DevOps 4%; Pro Services COGS 5%; other COGS 3%.
- Blossom Street Ventures (57 public SaaS, June 2026): median COGS about 26% of revenue and stable for four years; profitable companies run about 20%, unprofitable about 26%.
- Bessemer Cloud Index at-scale ($250-500M) public SaaS: cost of revenue about 29.1%, implying a blended gross margin near 71% (not the "mythical 85%").
Gross margin and valuation
- SaaS Capital: every 5-point gross margin improvement is worth roughly 1-2x of revenue multiple in enterprise value.
- Software Equity Group (Q2 2025): companies with more than 80% gross margin traded at a 105% premium to the SEG SaaS Index; that cohort had a median EV/TTM revenue of 7.2x versus 3.5x for sub-60% margin companies. Rubrik's gross margin rising from 69% to 78% coincided with its EV/TTM revenue nearly doubling, from 7.8x to 15.2x.
- a16z 2021 "The Cost of Cloud, a Trillion Dollar Paradox" (Sarah Wang, Martin Casado): for every $1 of gross profit recovered via repatriation, market cap rose about 24-25x; an estimated $4B of recovered gross profit implied roughly $100B of market cap across 50 top public software companies. The model assumes repatriation cuts cloud spend by about 50%. [1][2]
Infrastructure and cloud as a share of COGS
- Cloud hosting is typically 6-12% of SaaS revenue (EY-Parthenon); some 2025 benchmarks put it at 8-15% (Gartner/Harness), with fintech at 10-20%.
- Data transfer is often the third-largest AWS line item and can reach 30-40% of spend in heavily distributed architectures.
- Flexera 2026 State of the Cloud Report (N=753, published March 18, 2026): "After five years of decline, wasted cloud spend increased slightly to 29%, reflecting growing cost complexity from AI and new IaaS and PaaS services." The waste figure has hovered at 27-32% every year since 2019. At Gartner's roughly $675B 2025 cloud infrastructure market, that is about $182B wasted per year (over $100B on a conservative, idle-resource-only definition). [3][4]
AI inference and margin compression
- AI-native and AI-augmented gross margins run 50-60% versus 80-90% for traditional SaaS. Bessemer Venture Partners' AI pricing and monetization playbook (February 2026): "AI companies see 50-60% gross margins against 80-90% for traditional SaaS." [5]
- ICONIQ "State of AI" bi-annual snapshot (January 2026, from a Q4 2025 survey of about 300 executives): average AI product gross margin was 41% in 2024, 45% in 2025 and a projected 52% for 2026; the application layer alone tracks lower, 33% to 38% to 45%. The trend is improving but structurally below software. [6]
- "AI Supernovas" (thin model wrappers) can run about 25% or even negative gross margin; more mature "AI Shooting Stars" stabilise near 60%.
- a16z 2020 "The New Business of AI": AI company gross margins are "often in the 50-60% range... well below the 60-80%+ benchmark for comparable SaaS." Key advice: share a single model across customers rather than one model per customer, because that gap dominates COGS. [7][8]
- LLMflation (a16z, Guido Appenzeller, November 2024): for a model of equivalent performance, inference cost is "decreasing by 10x every year." A GPT-3-quality (MMLU 42) model cost $60 per million tokens in November 2021 versus about $0.06 three years later, a roughly 1,000x drop. Epoch AI puts the decline at 9x to 900x per year depending on the benchmark, with a median around 50x. [9]
- But total spend rises (Jevons paradox): a16z's OpenRouter data shows tokens consumed roughly quintupled while per-token prices fell to about a third over the same period. Reasoning/agentic workflows multiply this, with a single user action triggering 5-20 sequential model calls. [10][10]
- Cost levers with real numbers: OpenAI Batch API gives a flat 50% discount (24-hour window); prompt caching discounts cached input by roughly 75-90%; model routing within one vendor spans 5x or more (Claude Haiku versus Opus), and across a full model line up to about 600x. Routing is described by multiple 2026 analyses as the single biggest COGS lever.
Multi-tenancy economics
- Multi-tenant (pooled) architectures are widely cited as cutting infrastructure cost by 60-80% versus single-tenant deployments, using AWS Well-Architected SaaS Lens patterns.
- Pooled is roughly 4-8x cheaper to run than full silo-per-tenant, but it is the hardest to secure and to migrate off later.
- Illustrative COGS by model: a multi-tenant business at $10M ARR and 200 customers can run about 18% COGS (82% gross margin), whereas single-tenant infrastructure scales linearly and pushes COGS to 50-55%. One 2026 practitioner framing: multi-tenancy is "the architecture decision that quietly decides whether your SaaS margins hit 78% or 42%." [11]
- AWS SaaS Lens defines silo/pool/bridge models: silo gives the strongest isolation, highest cost and the simplest per-tenant cost tracking; pool costs the least but has the weakest isolation and the hardest cost attribution. AWS built a dedicated Cost Optimization pillar in the SaaS Lens precisely because attributing cost to tenants in shared infrastructure is hard.
FinOps and cost observability
- Only 43% of organisations track cloud costs at the unit level, per Flexera's 2025 State of the Cloud Report (reported via TechRadar): most cannot see cost per product, per customer or per feature. [12]
- 89% of respondents said lack of cloud cost visibility has an impact on their ability to carry out their role, with 46% describing that impact as significant, per CloudZero's 2024 State of Cloud Cost Report (survey of 1,000 finance and engineering professionals). [13]
- State of FinOps 2025 (FinOps Foundation, community responsible for over $69B of cloud spend): the biggest priority movers were managing AI/ML spend (+4 places), managing costs beyond public cloud (+5), and "getting to unit economics" (+5). State of FinOps 2026: FinOps now manages AI spend at 98% of organisations, up from 63% a year earlier, the fastest adoption in FinOps history.
- The FinOps Foundation names cost-per-customer / cost-per-tenant as the recommended first unit-economics metric to establish maturity.
Concrete case studies with numbers
- Dropbox: its "Infrastructure Optimization" project (2015-2017, the "Magic Pocket" build-out) saved almost $75M over two years; cost of revenue fell 6% in 2017 driven by a $35.1M infrastructure reduction; the company still uses AWS for under 10% of storage (2018 S-1). Secondary analyses widely report gross margin rising from 33% to 67% (cite carefully; the S-1 confirms the savings and margin improvement but the exact 33/67 split comes from secondary sources). By Q1 2026 Dropbox gross margin was about 81%, down 180 basis points year over year as it invests in AI ("Dash").
- 37signals (Basecamp/HEY): 2022 cloud bill of $3,201,564; the cloud exit cut the annual bill to about $1.3M (roughly $2M a year saved, about a 60% reduction); roughly $700K of Dell hardware was "entirely recouped" during the first year; projected savings now exceed $10M over five years. DHH's framing: "AWS operates at almost 40% margin. That means for every dollar you spend, 40 cents is pure profit." [14]
- Amazon Prime Video: the Video Quality Analysis team moved its monitoring service from serverless microservices (Step Functions, Lambda, S3) to a monolith on Amazon ECS and reported cutting infrastructure cost "by over 90 percent" (March 2023). The drivers were Step Functions state-transition costs and high volumes of Tier-1 S3 calls; the old design hit a scaling wall at about 5% of the target load.
- Segment: went the opposite way, consolidating "over 140 services into a single service." Before consolidation, three full-time engineers were "spending most of their time just keeping the system alive," operational overhead grew linearly with each new destination (about three added per month), and "as our velocity plummeted, our defect rate exploded." After consolidation, developer productivity rose (shared-library improvements went from 32 in a year under microservices to 46 the next year) and the test suite fell from up to an hour to milliseconds. (Alexandra Noonan, "Goodbye Microservices: From 100s of problem children to 1 superstar," July 10, 2018.) The trade-off they flagged: a bug in one destination can now crash the whole service. [15]
- Coinbase and Datadog: an approximately $65M single-year Datadog bill (2021, settled Q1 2022) surfaced when Datadog's CFO referenced "a large upfront bill... that did not recur." Coinbase built a Grafana/Prometheus/ClickHouse stack to move off; OpenAI has since reportedly set a new record Datadog bill. Datadog pricing stacks per dimension: infrastructure $15-23 per host, APM $31-40 per host plus $1.70 per million spans, logs $0.10/GB to ingest plus $1.70-2.55 per million events to index; enterprise bills regularly exceed $500K-$1M/year. [16][17]
- Cursor (Anysphere): in June 2025 it shifted the $20 Pro plan from 500 fast requests to "$20 of usage at API rates," then to usage-based limits; the CEO apologised in July 2025. The company's own blog: "Our users love per seat pricing. It's just the cost side makes it harder." One user reported consuming 252M tokens (worth roughly $838-$2,015 of API cost) on a $180/year subscription; the top 10% of users burned over 5 billion tokens in 2025. Anysphere has signed multi-year deals with OpenAI, Anthropic, Google and xAI. Its stated reason for repricing: "new models can spend more tokens per request on longer-horizon tasks." [18][19]
- Intercom Fin: outcome-based pricing at $0.99 per resolution (qualifications $9.99), with real-world resolution rates of 42-50%. Intercom renamed its corporate entity to Fin (May 2026) and Salesforce agreed to acquire it for roughly $3.6B (June 2026). This is the clearest example of the industry shift from per-seat to usage/outcome pricing to align price with inference COGS. Intercom's own framing: "for us to win, our users have to win." [20][21]
Data transfer and egress specifics
- AWS internet egress is $0.09/GB for the first 10TB (after 100GB free per month), tiering down to $0.05/GB above 150TB.
- Cross-AZ transfer is $0.01/GB in each direction, so a single gigabyte moving between two zones in the same region effectively costs $0.02 and is metered on both ends. Cross-region is about $0.02/GB. NAT Gateway adds $0.045/GB processing plus about $0.045/hour. Data transfer is typically 6-12% of cloud bills but can reach 40-60% for media, gaming and some SaaS workloads.
Healthcare/healthtech specifics
- The global telemedicine market was estimated at $141.19B in 2024 and is projected to reach $380.33B by 2030, a 17.55% CAGR (Grand View Research). [22]
- HIPAA compliance work commonly accounts for 20-30% of a telemedicine app's build budget; audit logging, data retention, encryption, Business Associate Agreements and access controls all impose architectural cost that shows up in COGS.
- Behavioral health patient acquisition costs run $1,000-2,500 per patient, and mental health cost-per-lead rose 146% year over year, another margin pressure specific to regulated digital health.
- Regulated industries push toward siloed/dedicated architectures (the higher-cost model) for data isolation and compliance, directly trading gross margin for regulatory safety. This is the mechanism by which clinical safety and data-residency requirements quietly lower the achievable margin ceiling for healthtech.
Details and interpretation
The core thesis holds up
The evidence strongly supports the thesis. Engineering teams optimise for latency, developer experience and reliability; the unit cost that determines gross margin is a byproduct of design choices that were never labelled as financial. Three data points make this concrete: only 43% of organisations track any unit cost (Flexera 2025), 89% say missing cost visibility hurts their work (CloudZero 2024), and cloud waste has been stuck at 27-32% for six years (Flexera). If engineers cannot see cost per unit, they cannot optimise for it, and the pricing model ends up designed independently of the architecture, which is exactly the takeaway you want to land.
Why the number is invisible
The multi-tenant/pooled architecture that delivers the 60-80% infrastructure savings underpinning SaaS economics is precisely the model in which cost attribution is hardest, because tenants share resources and the bill shows what was consumed, not by whom. So the very design that produces good margins also hides the per-tenant signal. That is why AWS created the Well-Architected SaaS Lens Cost Optimization pillar and why the FinOps Foundation recommends cost-per-tenant as the first unit metric to build.
The AI twist and the honest counter-case
The 80-90% SaaS benchmark is being replaced by a 50-60% AI reality because every request carries a variable inference cost. The most credible counter-argument comes from a16z itself: in "Questioning Margins is a Boring Cliche…" (Sarah Wang and Martin Casado, August 21, 2025), they argue that "lower gross margins at a moment in time are not a long term indicator of a lack of a sustainable business model," pointing to Amazon, Netflix, Uber and DoorDash as businesses once dismissed for thin margins, and note that inference costs "have dropped anywhere from 10x to 100x+ in the last 18 months." Crucially, they concede it is "too simplistic to tie dropping overall cost of inference to increased margins in apps." The honest position for a healthtech strategist: AI margins are structurally lower today, they may improve, but improvement is not automatic. It depends on routing to cheaper models, caching, batching and riding the LLMflation curve rather than staying locked to the frontier. "Model inertia," running last quarter's expensive model long after cheaper equivalents ship, is the main reason most teams capture little of the falling-cost benefit. [23]
Recommendations
- Make unit cost a first-class, visible metric now. Instrument cost per customer/tenant and cost per inference/transaction, and surface it where design decisions actually happen: engineering dashboards, pull-request checks and CI. If you do not track any unit cost, you are behind the 43% who do (Flexera). Start with cost-per-tenant, the FinOps-recommended entry metric.
- Treat cost as a non-functional requirement, ranked alongside latency and reliability. Give every new feature a cost budget the way you give it a latency SLO, and put cost on the same observability dashboard as p99 and error rate rather than in a separate finance spreadsheet.
- Attack the biggest architecture levers in order of margin impact: multi-tenancy model (60-80% infrastructure swing), model routing for AI features (5x to ~600x spread), batch/async processing where latency allows (50% via Batch API), prompt caching (75-90% on cached prefixes), data transfer topology (keep traffic in-AZ; audit NAT Gateway and cross-AZ chatter), observability retention and sampling, and storage tiering plus retention defaults.
- For AI features specifically: route by task difficulty, cache aggressive prompt prefixes, batch anything non-interactive, and re-evaluate model choice at least quarterly to beat model inertia. Move pricing toward usage or outcome-based where power users can break per-seat unit economics; Cursor's 2025 backlash and Intercom Fin's $0.99-per-resolution model are the two reference points.
- Thresholds that should change the plan: if an AI feature's gross margin drops below roughly 50%, treat it as a joint pricing-and-architecture emergency; if hosting exceeds 12-15% of revenue, audit topology and commitment discounts; if any single vendor line (observability, or one customer's compute) exceeds about $2-3M/year, model build-versus-buy, which is roughly the threshold at which Coinbase justified an in-house observability team against Datadog.
Caveats
- Many benchmark figures come from vendors (CloudZero, Flexera, FinOps tooling companies) and self-reported surveys; treat exact percentages as directional rather than precise. The Dropbox "33% to 67%" gross-margin figure is repeated widely by secondary sources; the S-1 confirms the roughly $75M in savings and the margin improvement, but the exact split should be attributed to secondary reporting, not the filing.
- The a16z 2021 repatriation math (24-25x market cap uplift, 50% savings) is contested, notably by Corey Quinn (Last Week in AWS) and CloudZero; it assumes committed spend equals actual spend and that recovered gross profit flows straight through to market cap.
- 37signals figures are founder-reported (DHH via LinkedIn and podcasts). The Prime Video 90% figure is one team's specific workload, not a general verdict against serverless; and Segment's monolith reversal is a developer-productivity story, not primarily a cloud-bill story, so use each case for the right point.
- Lower gross margin can be a rational strategic choice (land-grab, category creation, buying market share), and premature cost optimisation can harm reliability and velocity; engineers over-indexed on cost can degrade the product. Do not weaponise this research into blanket cost-cutting.
- Gross margin definitions vary widely (what counts as COGS: support, customer success, onboarding, implementation), so cross-company comparisons are noisy. The "shadow services" misclassification, burying delivery labour in sales and marketing, can inflate reported gross margin by a meaningful amount.
Most surprising or counter-intuitive findings
- Cloud waste has never meaningfully fallen: it has stayed at 27-32% since 2019 despite the entire FinOps industry existing to fix it, and it actually rose to 29% in 2026, driven by AI.
- The architecture that gives SaaS its excellent margins (multi-tenancy) is the same one that hides the per-customer cost signal, which is why so few teams can answer "what does this customer cost to serve?"
- Cross-AZ "high availability" quietly bills you twice for the same gigabyte ($0.02 round trip), and data transfer can be 40-60% of the bill for some companies, a cost almost never visible in an architecture diagram.
- Falling token prices do not lower AI bills; usage growth outruns price declines (Jevons paradox), so cheaper inference tends to raise total spend, not cut it.
- Amazon's own Prime Video team publicly cut costs 90% by abandoning the serverless architecture Amazon sells to everyone else.
- An "average" Cursor user consumed roughly $838-$2,015 of tokens on a $180/year plan, and the top 10% burned over 5 billion tokens each in 2025, an unambiguous case of power users breaking per-seat unit economics.
- a16z has argued both sides: it warned in 2020-2021 that AI margins would be structurally low, then argued in August 2025 that "questioning margins is a boring cliche," a useful tension to cite honestly rather than picking one.
- NetApp Community — https://community.netapp.com/t5/General-Discussion/The-Cost-of-Cloud-a-Trillion-Dollar-Paradox/m-p/167370
- Technologyforyou — https://www.technologyforyou.org/the-cost-of-cloud-a-trillion-dollar-paradox/
- Flexera — https://info.flexera.com/CM-REPORT-State-of-the-Cloud?lead_source=Organic+Search
- SpendArk — https://spendark.com/blog/state-of-cloud-waste-2026/
- Digital Applied Team — https://www.digitalapplied.com/blog/ai-unit-economics-pricing-margins-services-2026-framework
- Upstarts Media — https://www.upstartsmedia.com/p/data-ai-startup-margins-rise
- Andreessen Horowitz — https://a16z.com/the-new-business-of-ai-and-how-its-different-from-traditional-software/
- I-Kang's Notes — https://ikding.github.io/new-business-of-ai-a16z.html
- Andreessen Horowitz + 4 — https://a16z.com/llmflation-llm-inference-cost/
- SoftwareSeni — https://www.softwareseni.com/why-ai-gross-margins-are-so-much-lower-than-saas-and-what-that-means-for-your-business/
- ZANISS SOFTWARES — https://zanisssoftwares.com/blog/multi-tenant-saas-architecture-patterns-2026
- techradar — https://www.techradar.com/pro/when-cloud-growth-outpaces-control-waste-follows
- DevOps — https://devops.com/survey-credits-engineering-teams-with-keeping-lid-on-cloud-costs/
- Inspectural — https://inspectural.com/blog/dhh-was-right-37signals-analysis/
- twilio + 5 — https://www.twilio.com/en-us/blog/developers/best-practices/goodbye-microservices
- The Pragmatic Engineer — https://blog.pragmaticengineer.com/datadog-65m-year-customer-mystery/
- byteiota — https://byteiota.com/observability-costs-2026-why-datadog-bills-explode-fix/
- saastr — https://www.saastr.com/cursor-our-users-love-per-seat-pricing-its-just-the-cost-side-makes-it-harder
- TechCrunch — https://techcrunch.com/2025/07/07/cursor-apologizes-for-unclear-pricing-changes-that-upset-users/
- Macha — https://www.getmacha.com/blog/intercom-fin-ai-agent-complete-guide
- Stripe — https://stripe.com/customers/fin-ai
- Grand View Research — https://www.grandviewresearch.com/industry-analysis/telemedicine-industry
- a16z + 5 — https://a16z.com/questioning-margins-is-a-boring-cliche/
Commissioned from our research desk. Subject to final editorial discretion.
How architecture decisions silently set the ceiling on gross margin, and why most engineering orgs never see that number. Cover the disconnect between teams optimizing for latency, developer experience, or reliability while unit cost per customer, per transaction, or per inference is determined by choices nobody framed as financial—multi-tenancy model, data retention defaults, model selection, synchronous versus batch processing. Research SaaS gross margin benchmarks, infrastructure cost as a percentage of revenue, and how AI inference costs are compressing margins in AI-augmented products. Takeaway: expose per-unit cost telemetry to the teams making design decisions, or accept that your pricing model and your architecture were designed independently.