How organizations consistently underinvest in the ability to actually evaluate whether a technical initiative worked after it shipped
BY STAVROS · MAY 16, 2026
The proof is indisputable.
THE INSIGHT
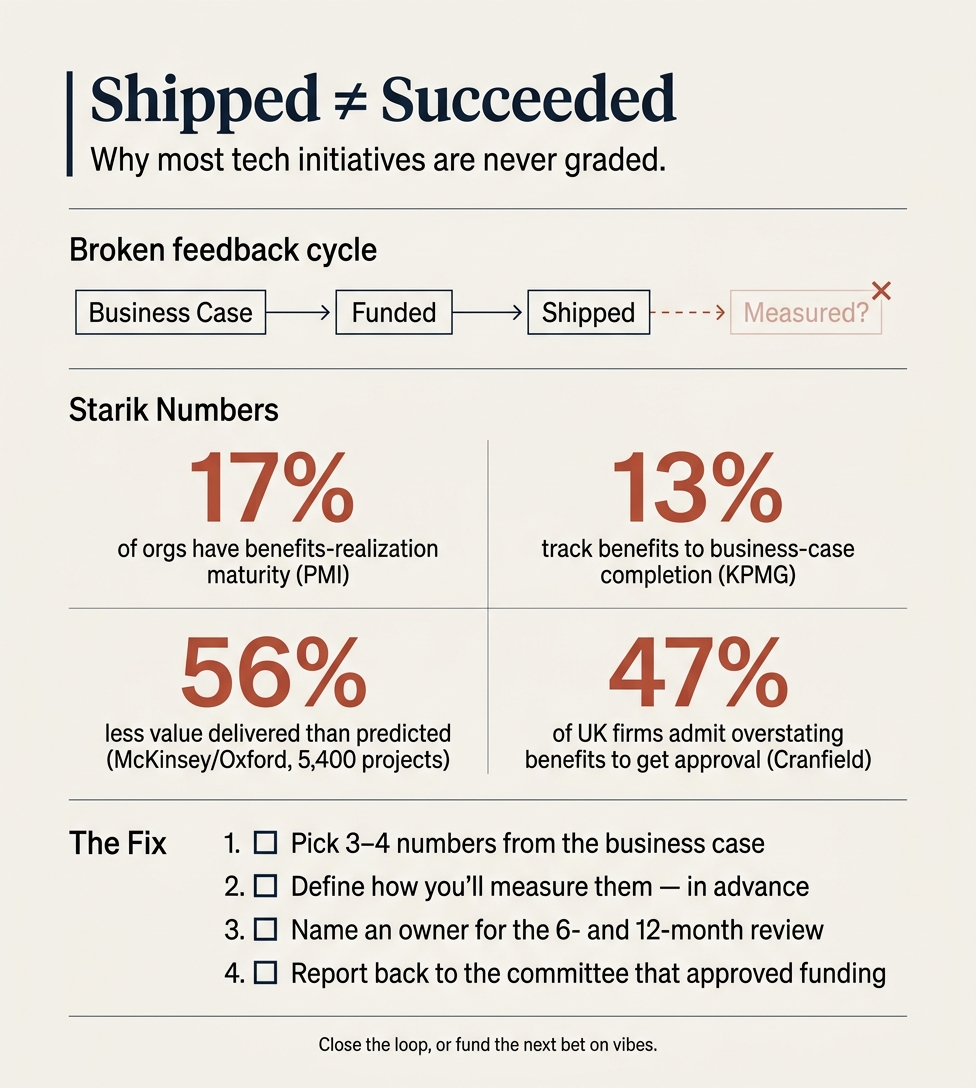
Something I've been thinking about: the asymmetry in how organizations treat technical initiatives. We build elaborate business cases to get them funded, full of latency targets and cost models and productivity projections, and once the thing ships, almost nobody checks whether any of it turned out to be true.
The numbers are quietly stark. PMI finds only 17% of organizations have real maturity around benefits realization, and KPMG found only 13% track benefits until the original business case commitments are met. McKinsey and Oxford studied 5,400 large IT projects and found they deliver 56% less value than predicted, and most sponsors don't know, because they never measured.
There's an awkward layer underneath. Cranfield researchers found 47% of large UK companies openly admitted overstating benefits in their business cases to get approval. So the document we ought to compare against was already optimistic by design, and we then quietly decline to compare against it.
The pattern is everywhere. A latency improvement that justified the rewrite gets benchmarked on launch day and never again. Cloud migration savings live in a slide deck and never appear in finance actuals, part of why Flexera has measured cloud waste at roughly 30% every year since 2019, despite a decade of FinOps tooling. AI coding rollouts claim productivity bumps nobody instruments, even though Stack Overflow found 76% of developers using AI at work couldn't describe how their employer measures productivity. A METR study last year found experienced developers were 19% slower with AI assistance while believing they were 20% faster.
Even the Standish CHAOS report, our most cited IT success benchmark, never included whether projected ROI actually materialized. The one year they added business value to the criteria, the success rate collapsed to 14%.
What bothers me is the compounding effect. If you never close the loop, every funding decision rests on the credibility of past business cases, and those look credible only because nobody graded the previous ones. Over time you stop running a portfolio of investments and start running folklore, where shipped projects are remembered as wins because no one ever compared them to the promises that funded them.
The fix is less elaborate than people assume. Pick three or four numbers from the business case that genuinely matter, write down in advance how you'll measure them, name a specific person who owns measuring them at six and twelve months after launch, and put the results in front of the same committee that approved the funding. The first few cycles will be uncomfortable, and they'll also be the first time the organization actually knows which bets pay off.
THE EVIDENCE
The unmeasured trillions: research on post-implementation evaluation gaps in IT
The evidence is overwhelming and remarkably consistent: organizations rarely verify whether their technical initiatives delivered the value promised in their business cases. Only 17% of organizations have high benefits realization maturity (PMI), only 13% of organizations track benefits until commitments are met (KPMG), and the most rigorous study of large IT projects ever conducted found they deliver 56% less value than predicted (McKinsey/Oxford, 5,400 projects). When the Standish Group defines project "success," it has never included benefits realization in its definition — meaning even the most-cited IT success benchmark in the industry doesn't measure whether projected ROI actually materialized. Below is the research material organized by theme for use in a LinkedIn post.
1. Post-implementation review (PIR) adoption and benefits realization maturity
PMI Pulse of the Profession — the canonical statistics
- Only 17% of organizations report high benefits realization maturity (PMI Pulse of the Profession 2016, The High Cost of Low Performance). Direct quote: "Our research confirms that only 17 percent of organizations report high benefits realization maturity, raising myriad questions about how other organizations determine the business value of projects." [1]
- 83% of organizations lack maturity with benefits realization (PMI Pulse of the Profession). PMI quote: "a staggering 83 percent of organizations lack maturity with benefits realization." [2][3]
- Fewer than 1 in 10 organizations report having very high maturity with their value delivery capabilities (PMI 2018, Success in Disruptive Times). Only 31% are prioritizing developing one. [4]
- Champion organizations waste 21× less money than underperformers (PMI 2018) — 92% project success rate vs. 32% for laggards. [5]
- $97 million wasted for every $1 billion invested in projects/programs globally; previously $122M (PMI Pulse 2016–2017).
KPMG Global IT Project Management Survey 2005 (600+ orgs, 22 countries — old but the definitive benchmark on benefits-tracking practices)
- Only 2% of organizations achieve targeted benefits all the time [6]
- Only 41% have any form of benefits realization process
- Only 13% measure until commitments are met — direct quote: "Only 13 percent track benefits until they are realized and formally reported on, with 31 percent indicating that tracking stops earlier." [6]
- 86% of organizations lost up to 25% of target benefits across their entire project portfolio [6]
- In only 23% of cases is delivery of project benefits tied to individual executive performance plans and rewards [7]
Academic and other surveys
- Only 31% measure benefits realization after delivery of projects (Mossalam & Arafa, 2015, peer-reviewed in Egyptian Journal of Remote Sensing & Space Science). [8]
- Less than 40% of organizations effectively measure benefits delivered by projects/programs; of those that do, only ~20% of potential benefits are actually realized (Bradley, Benefits Realisation Management, 2010/2014). Bradley's famous line: "Benefit realization is the neglected treasure… if only a fifth of business case benefits are actually realized, a business case would have to predict a return of 400% for the project to break even." [9]
2. The gap between business case and actual outcomes
The most-cited single source: McKinsey-Oxford 2012
Study of 5,400+ large IT projects with the BT Centre for Major Programme Management at Oxford:
- Large IT projects (>$15M) run 45% over budget, 7% over time, and deliver 56% less value than predicted [10][11]
- 17% of IT projects go so badly they "threaten the very existence of the company" ("black swans" = overruns of 200–400%) [11][12]
- Total cost overruns across the sample: $66 billion — more than Luxembourg's GDP [13][12]
- Every additional project year increases overruns by 15% [13][12]
- Large software projects specifically run 66% over budget and 33% over schedule (McKinsey, Achieving success in large, complex software projects) [14][15]
- Quote: "On cost alone, substantial overruns occur in almost 90% of large IT-enabled projects" (McKinsey Digital, IT Project Optimization). [16]
McKinsey on digital transformation success rates
- Only 16% of digital transformations successfully improve performance and sustain those gains (McKinsey Global Survey 2018). Traditional industries: 4–11% success.
- "The academic research is really clear that when corporations launch transformations, roughly 70 percent fail." (Harry Robinson, McKinsey senior partner, 2019). [17]
Boston Consulting Group
- Only 30% of digital transformations meet or exceed target value with sustainable change. 26% create limited value (<50% of target) with no sustainable change. (BCG, Flipping the Odds of Digital Transformation Success, 2020, 825-exec survey). [18][19]
- 30% of companies fully meet timeline, budget, and scope expectations in large-scale tech programs (BCG 2024). [20]
- AI specifically: Only 4% of companies are creating substantial value from AI; only 22% have moved beyond proof-of-concept (BCG, Where's the Value in AI?, 2024, 1,000 CxOs across 59 countries). [21][22]
Bain & Company
- Only 12% of companies achieve their full transformation targets — flat for over a decade (Bain 2023 Transformation & Change Survey of 400+ executives). 88% fall short. 68% settle for "value dilution." [23]
Flyvbjerg / Oxford academic research (most rigorous database)
- HBR 2011: 1,471 IT projects analyzed — average cost overrun 27%, but 1 in 6 became "black swans" with average 200% cost overrun and ~70% schedule overrun (Flyvbjerg & Budzier, Why Your IT Project May Be Riskier Than You Think). [24]
- How Big Things Get Done (2023): Across 16,000+ projects, 91.5% go over budget, over schedule, or both. Only 0.5% hit cost, time, AND benefits. Iron law of megaprojects: "over budget, over time, under benefits, over and over again." [25][26]
- IT projects average 73% over budget; 18% of IT projects overrun by an average of 447% (Flyvbjerg database). [27][28]
- 2022 academic paper in Journal of Management Information Systems: IT project cost overruns follow a power-law distribution — extreme overruns are far more likely than managers assume. [29]
Other consulting evidence
- 92% of respondents said their tech investments haven't fully delivered the expected results (PwC's 2025 Digital Trends in Operations Survey).
- 75% of large-scale transformation initiatives fail to meet objectives (PwC Switzerland). [30]
- Three-quarters of digital transformations fail to generate returns exceeding original investment; of failures, 70% are due to lack of user adoption and behavioral change (PwC Canada).
- 67% of senior leaders have experienced at least one underperforming transformation in the last 5 years (EY/Oxford Saïd Business School, 935 leaders + 1,127 workforce members, 23 countries).
- 73% of leaders cite "inability to define metrics" as the top barrier to measuring digital transformation value (Deloitte 2023 Measuring Value from Digital Transformation Survey, 1,600 respondents). [31][31]
- Only 42% of companies achieve expected returns from cloud (Accenture). [32]
3. The Standish CHAOS report and the missing definition of success
This is one of the most important — and underappreciated — facts for the post:
- The Standish definition of "success" has never included benefits realization or ROI measurement. Original (1994–2014): "on time, on budget, with all features and functions as initially specified." Modern (2015+): "on time, on budget, with a satisfactory result." Customer satisfaction is the only outcome dimension included — and even this measures perception, not value capture. [33]
- When Standish did measure customer satisfaction plus ROI together ("pure success") in CHAOS 2018, only 14% of projects qualified as successful (67% challenged, 19% failed). [34]
- CHAOS 2020 (database of 50,000+ projects across 1,000+ organizations): ~31% successful, 50% challenged, 19% failed. Large projects succeed less than 10% of the time. [35]
- Implication for the post: The most widely cited IT project benchmark in the industry doesn't measure whether projected ROI materialized. So even "successful" projects in the headline statistic are typically untested against business outcomes.
- Academic caveat: Standish methodology has been critiqued (Eveleens & Verhoef, 2010, IEEE Software) for biased sampling — worth flagging if academic rigor is required.
4. Cloud migration and FinOps — savings that may never appear
Cloud waste is structural, not cyclical
- Estimated wasted cloud spend: 30% (2019), 30% (2020), 32% (2021), 28% (2022), 28% (2023), 27% (2024), 27% (2025), 29% (2026) — Flexera State of the Cloud reports. The rate has been "remarkably stable" for nearly a decade despite massive FinOps tooling investment. At Gartner's projected
$675B in 2025 cloud infrastructure spend, this implies **$180B+ in waste globally annually**. [36]
- 84% of organizations say managing cloud spend is the top cloud challenge (Flexera 2025) — top challenge for multiple consecutive years. [37]
- Cloud budgets are exceeded by 17% on average (Flexera 2025). [37]
Forecasts are routinely wrong
- 69% of IT leaders reported budget overruns in their organization's cloud spending in 2023 (Gartner Peer Community survey, 200 IT leaders). [38]
- Gartner prediction: "Through 2024, 60% of infrastructure and operations leaders will encounter public cloud cost overruns that negatively impact their on-premises budgets" (cited in IBM Think Insights). [39][40]
- CloudZero research: cloud bills run 5–30% higher than forecasted; ADAPT: 36% of organisations can't reliably link cloud spend to business value. [41][41]
- a16z (The Cost of Cloud, a Trillion Dollar Paradox, 2021): some companies exceeded committed cloud forecasts by at least 2X; cloud margin pressure has erased an estimated $100B in public software-company market value. [42]
Cloud value is unmeasured or unrealized
- Only 10% of companies have fully captured cloud's potential value; 40% have seen no material value (McKinsey, In search of cloud value, Nov 2023). "An average company adopting cloud today could achieve 180 percent ROI in business benefit, although few are getting close." [43][43]
- McKinsey's CloudSights database: 40% of 80+ enterprises found limited value in their cloud programs. Half of companies 5+ years into their cloud journey hadn't achieved 20% cloud adoption. [44]
FinOps maturity is low
- FinOps Foundation accepts 20% variance between forecasted and actual spend as the "Crawl" maturity level. Most respondents still working to improve accuracy (FinOps Foundation Framework). [45]
- State of FinOps 2025 (861 respondents, $69B+ cloud spend): 50% rank waste reduction as #1 priority (3rd year running); forecasting is #3. [46][47]
- More than half of organizations don't even use commitment-based discounts for compute (ProsperOps analysis of State of FinOps 2024). [48]
Public sector parallel — perfect "unmeasured" case study
- GAO 2019: Federal agencies' cloud savings figures are "likely inaccurate" because agencies couldn't systematically track them. Only 13 of 16 agencies could quantify any savings, totaling $291M, "likely underreported because no consistent method existed." [49]
- GAO 2022 follow-up: three years later, recommendations on tracking cloud savings remained unimplemented. [50]
The headline GitHub Copilot study has serious limitations
- The famous "55.8% faster" Copilot productivity stat (Peng et al., arXiv:2302.06590, Feb 2023, GitHub-authored) is from a single, contrived task: implement a JavaScript HTTP server. 95 developers, no real codebase. Measures task completion time only — not code quality, maintainability, or business outcomes. Funded by GitHub. [51]
The most rigorous independent study found the opposite
- METR 2025 randomized controlled trial (Becker, Rush, Barnes, Rein, arXiv:2507.09089, July 2025): 16 experienced open-source developers, 246 real issues, Cursor Pro + Claude 3.5/3.7 Sonnet: [52]
Developers were 19% SLOWER with AI tools allowed [53]
Pre-study, devs predicted 24% speedup. Post-study, after experiencing the slowdown, they still believed they were ~20% faster. [54][55]
ML experts predicted 38% speedup; economists predicted 39% — actual: 19% slowdown. ~57-point gap between expert forecasts and reality. [56]
- Developers were 19% SLOWER with AI tools allowed [53]
- Pre-study, devs predicted 24% speedup. Post-study, after experiencing the slowdown, they still believed they were ~20% faster. [54][55]
- ML experts predicted 38% speedup; economists predicted 39% — actual: 19% slowdown. ~57-point gap between expert forecasts and reality. [56]
- Independent replication: ELEKS found 10–15% productivity improvement, not 55%. [57]
Most organizations are not measuring AI ROI
- 76% of developers using AI tools at work told Stack Overflow they were unsure of how their organization measures productivity (Stack Overflow 2024 Developer Survey). This is arguably the single most damning statistic in the dataset — 3 in 4 AI-using devs cannot articulate how their employer measures productivity. [58]
- Stack Overflow 2025: 84% using or planning to use AI tools, but only 29% trust them — down 11 points from 2024. Only 17% of agent users say agents improved team collaboration. [59][60]
DORA's organizational data contradicts the individual productivity narrative
- DORA 2024: A 25% increase in AI adoption is associated with a 1.5% decrease in delivery throughput and a 7.2% decrease in delivery stability — even though 75% of developers report individual productivity gains. [61]
- 39% of respondents reported little to no trust in AI-generated code (DORA 2024). [61][61]
- DORA 2024: high-performance cluster shrank from 31% to 22% YoY; low cluster grew from 17% to 25%. [62]
- DORA 2025: AI adoption reached 90% (up 14 points YoY). Key quote: "AI doesn't fix a team; it amplifies what's already there. Strong teams use AI to become even better… Struggling teams will find that AI only highlights and intensifies their existing problems." [63]
Engineering leaders admit their metrics are broken
- Atlassian × DX State of Developer Experience Report 2024 (2,100+ developers and managers): 97% of developers lose significant time to inefficiencies; 69% lose >8 hours/week. "Most leaders admit the metrics they track are inefficient at measuring developer productivity"; 41% use the same tools to measure productivity AND satisfaction. [64]
- Two out of three developers aren't seeing significant productivity gains from using AI tools (Atlassian 2024). [64]
- Atlassian 2025: empathy gap widening — 63% of developers feel leaders don't understand their pain points (up from 44%).
Code-quality data suggests gains may have offsetting costs
- GitClear 2024 (153M lines of changed code, 2020–2023; expanded to 211M lines through 2024): [65]
Code churn (lines reverted within 2 weeks): 3.1% (2020) → 5.7% (2024) — projected to double vs. pre-AI baseline [66][65]
Copy/pasted lines: 8.3% (2020) → 12.3% (2024) — 48% relative increase [67][66]
"Moved" (refactored) lines: 24.1% (2020) → 9.5% (2024) [67][66]
2024 was the first year ever where new repeated code introduction exceeded refactoring activity [68]
- Code churn (lines reverted within 2 weeks): 3.1% (2020) → 5.7% (2024) — projected to double vs. pre-AI baseline [66][65]
- Copy/pasted lines: 8.3% (2020) → 12.3% (2024) — 48% relative increase [67][66]
- "Moved" (refactored) lines: 24.1% (2020) → 9.5% (2024) [67][66]
- 2024 was the first year ever where new repeated code introduction exceeded refactoring activity [68]
McKinsey's own developer productivity paper sparked industry backlash
- McKinsey, Yes, You Can Measure Software Developer Productivity (August 2023), proposed adding McKinsey-proprietary metrics on top of DORA and SPACE.
- Reception: Kent Beck called it "absurd and naive"; Gergely Orosz published a 12,000-word rebuttal in The Pragmatic Engineer. Critics argued the framework reverts to individual-level surveillance, contradicting SPACE/DORA team-level guidance. [69][70]
Frameworks exist but adoption is patchy
- The SPACE framework (Forsgren, Storey, Maddila, Zimmermann, Houck, Butler — ACM Queue, Feb 2021) explicitly states: "Productivity cannot be captured by a single metric and must be understood across multiple dimensions simultaneously." It recommends team-level measurement across at least 3 of 5 dimensions. [71]
- Per Atlassian 2025, 50% of teams now claim to use SPACE — currently the most-adopted measurement framework.
6. Why organizations underinvest — behavioral, organizational, and structural reasons
The killer quote on why PIRs don't happen
"No wonder few companies engage in post-implementation reviews. They already know that many of the benefits contained in the business case are unlikely to be achieved. In addition, if they have not clearly identified the expected benefits, they have no criteria for assessing success. If benefits were overstated, no-one will be keen to hold a review."
— Peppard, Ward & Daniel (2007), MIS Quarterly Executive [72]
Benefits are inflated by design
- 47% of the 200 largest UK companies openly admitted to overstating benefits to get approval for IT investments (Ward, Taylor & Bond, European Journal of Information Systems, 1996). The structural implication: an honest PIR is threatening, so it doesn't happen. [73][74]
Cognitive bias
- Lovallo & Kahneman, Delusions of Success (HBR, July 2003): "The evidence is disturbingly clear: Most major business initiatives—mergers and acquisitions, capital investments, market entries—fail to ever pay off" due to the planning fallacy — anchoring, optimism bias, competitor neglect, and organizational pressure.
- Flyvbjerg, Top Ten Behavioral Biases in Project Management (Project Management Journal, 2021): for large IT/megaprojects, strategic misrepresentation (deliberate "cooking" of forecasts) is at least as important as cognitive optimism bias. "Costs are underestimated, schedules are underestimated, and benefits are overestimated." [75]
- Sunk-cost-induced escalation of commitment to failing IT projects is experimentally demonstrated and culturally robust (Keil et al., MIS Quarterly 2000; Keil, Truex & Mixon, IEEE Transactions on Engineering Management 1995). [76][77]
Survivorship bias in case studies
- "Case studies are written about successes, not abandoned attempts. Conferences feature speakers who achieved results, not teams whose projects stalled… If you group successes together and look for what makes them similar, the only real answer will be luck." (Wise, Harrisburg University, 2023, Journal of the Center for Project Management Innovation). [78][79]
The "team already moved on" pattern
- Goffin et al. on R&D PIRs: "PPRs are the last meeting of a project team… usually held after team members have been assigned to new projects and so when interest in the previous project is low. NPD teams perceive PPRs as a compulsory but not important exercise (seeing them as 'just another required tick in the box')."
- Williams et al. (PMI Symposium 2001; expanded 2007): "Project failure and success are rarely analyzed by individual companies, and learning just doesn't happen… Frequently this is because the next bid and the next project are pressing and too urgent to leave time to reflect." [80]
- HRA Consulting: "A Post Implementation Review is conducted after the project has finished and usually after the project team has been disbanded" — leaving no one with the resources or authority to capture benefit data. [81]
Lessons-learned theatre
- "You publish your notes to the lessons learned repository, never knowing if anybody will read them. In time, your notes get forgotten. Nobody wants to go through multiple years of lessons learned documents." (ProjectManagement.com, Stoneham). [82]
- Quay Consulting / NSW Auditor-General: "All too often project teams are more interested in commencing the next project rather than reflecting on what went right and what went wrong." [83]
Blame culture kills review honesty
- "When post-implementation reviews are treated as blame exercises rather than learning opportunities, teams actively avoid them. The PM who ran a difficult project does not want to sit in a room and have their decisions picked apart." (Project Management Formula 2024). [84][84]
Politics of evaluation
- Gwillim & Lin, The politics of post-implementation reviews: "The attitude prevails that if ex post evaluation is conveniently forgotten, the staff reductions or other benefits promised at the project approval stage will be forgotten as well… [Evaluation is seen as] 'a measure of embarrassment.'" [85]
Frameworks demand PIR — practice ignores them
- COBIT 2019 EDM02 ("Ensured Benefits Delivery") mandates post-implementation reviews and benefits-realization plans. ISACA: "the only valid reason for investing in technology-enabled change is to generate benefits." [86][87]
- ITIL 4 requires PIRs as part of Change Enablement and Continual Improvement. Its own guidance flags the gap: improvements are "often identified but never implemented due to a lack of ownership or resources." [88]
- PMI/PMBOK mandates a Lessons Learned Register; Williams (PMI 2007): "In practice, the lessons learned from a specific project are rarely incorporated into an organization's overall policies and procedures." [89][90]
7. Aggregate scale — how much money is flowing past PIR
- Worldwide IT spending: ~$5.43 trillion in 2025; ~$6.08 trillion forecast for 2026 (first time above $6T) — Gartner. [91][92]
- Enterprise IT spending alone: $4.7 trillion in 2026 (CAGR 8.9% through 2029) — Gartner. [93]
- Annual cost of operational software failures in the US (2022): $1.81 trillion, plus $260 billion in failed development projects (CISQ, summarized in IEEE Spectrum, Dec 2025, Robert N. Charette, The Trillion-Dollar Cost of IT's Willful Ignorance). [94]
- ~70% of digital transformations fail to deliver intended outcomes; an estimated $2.3 trillion has been wasted globally on unsuccessful digital transformation programs (Harkin 2024, derived from IDC + McKinsey figures — treat as illustrative; widely cited but derived, not audited). [95][96]
- Cloud waste alone: ~$180B+ annually at current global cloud spend × Flexera's 27–29% waste rate.
8. Quick-reference quotables (best one-liners for the post)
| Statistic | Source |
|---|
| "Only 17% of organizations report high benefits realization maturity" | PMI Pulse of the Profession 2016 |
| "Only 13% measure benefits until commitments are met" | KPMG Global IT PM Survey 2005 |
| "Only 2% of organizations achieved targeted benefits all the time" | KPMG 2005 |
| Large IT projects deliver56% less value than predicted | McKinsey/Oxford 2012 (5,400 projects) |
| 17% of IT projects threaten the existence of the companyMcKinsey & Company | McKinsey/Oxford 2012 |
| Only0.5% of projectshit cost, time, AND benefits | Flyvbjerg,How Big Things Get Done(2023, 16,000 projects) |
| 47% of large UK companies admitted overstating benefitsto get IT approval | Ward, Taylor & Bond 1996 |
| Of orgs thatdomeasure benefits, only**~20% of potential benefits are realized** | Bradley,Benefits Realisation Management |
| 92% of tech investments don't fully deliver expected results | PwC 2025 Digital Trends in Operations |
| 30% of cloud spend wasted every year since 2019 | Flexera State of the Cloud (annual, 2019–2026) |
| 69% of IT leaders reported cloud budget overruns in 2023Gartner | Gartner Peer Community |
| GAO: federal cloud savings figures are**"likely inaccurate"** | GAO-19-58, reaffirmed in GAO-22-106195 |
| Only10% of companies have fully captured cloud's potential value; 40% see no material value | McKinsey 2023 |
| 76% of devs using AI at work don't know how their org measures productivityLogisticsit | Stack Overflow 2024 |
| Independent RCT: AI tools made experienced devs19% slowerwhile they believed they were 20% faster | METR 2025 (arXiv:2507.09089) |
| DORA 2024: a 25% rise in AI adoption is linked to a7.2% decrease in delivery stabilityGoogle Cloud | DORA State of DevOps 2024 |
| GitHub Copilot's famous "55% faster" stat is from asingle contrived task(build a JS HTTP server) | Peng et al., arXiv:2302.06590 (GitHub-authored) |
| GitClear 2024:code churn doubledGitClearand refactoring collapsed since AI tool adoptionMedium | GitClear 2024/2025 |
| Standish "success" has never included benefits realization— only on-time/on-budget/satisfactory | Standish CHAOS 1994–2020 |
| When Standishdidmeasure value + satisfaction together, only14% of projects qualified | CHAOS 2018 |
9. Caveats and source quality notes
- The McKinsey/Oxford "45/7/56" study is from 2012 and remains the canonical reference. There is no published update at comparable scale, so it gets cited continuously but reflects pre-2012 data.
- The "70% of transformations fail" figure is folkloric; McKinsey's own survey data put successful transformations at 20–26%, which is the empirical basis.
- Standish CHAOS is methodologically critiqued in academic literature (Eveleens & Verhoef, 2010, IEEE Software); cite with the framing "widely cited industry benchmark."
- The "60% skip PIRs" figure that circulates on vendor blogs (Crowdtrust and similar) cannot be traced to a verified primary survey; do not cite as a hard statistic.
- The "$2.3 trillion wasted on digital transformation" comes from a book/promotional source (Harkin 2024) deriving the number from IDC spend × McKinsey ~70% failure rate. Treat as illustrative. [97]
- Flexera State of the Cloud waste figures are self-reported by cloud decision-makers — estimates, not audited.
- DX research and GitClear are methodologically credible but commercially motivated (both sell tooling); flag accordingly.
- The METR 2025 study is the gold-standard RCT methodology but has a small N (16 developers, 246 issues); METR itself cautions against over-generalizing beyond mature OSS codebases. [52][98]
- GitHub's Copilot study is peer-reviewed but funded by GitHub and uses a single toy task — its 55% figure has become marketing despite generalizability concerns.
10. Most powerful narrative threads for a LinkedIn post
Three intellectually defensible angles emerge from this research:
(a) The asymmetric incentive problem. Business cases are systematically inflated to win approval (Ward 1996: 47% admit it; Flyvbjerg: strategic misrepresentation), then never tested against actuals because doing so would surface the inflation. The result: an entire industry that has never empirically validated its own ROI claims, with research showing only 13% of organizations track benefits until commitments are met (KPMG) and 83% lack benefits realization maturity (PMI).
(b) The perceived-vs-measured gap, sharpest in AI tools. GitHub claims 55% faster; the independent METR RCT finds 19% slower; developers in the slowdown still believed they were 20% faster; and 76% of AI-using developers can't articulate how their org measures productivity. The pattern repeats in cloud (McKinsey: only 10% captured full value), transformations (Bain: 12% achieve full targets), and large IT projects (McKinsey/Oxford: 56% less value than predicted). [55]
(c) Even the success benchmark doesn't measure success. The Standish CHAOS Report — the most-cited IT project benchmark — defines success as on-time/on-budget/satisfactory result. It has never included whether projected ROI materialized. When value was added to the definition in CHAOS 2018, "success" dropped to 14%. The industry's flagship measurement of project success is itself a post-implementation review gap.
- Project Management Institute — https://www.pmi.org/-/media/pmi/documents/public/pdf/learning/thought-leadership/pulse/pulse-of-the-profession-2016.pdf
- PMI — https://www.pmi.org/learning/thought-leadership/pulse/focus-on-benefits-during-project-execution
- PMI — https://www.pmi.org/learning/thought-leadership/pulse/identify-benefits-business-results
- Psisolution — https://www.psisolution.com/files/9815/4959/7375/benefits-realization-management.pdf
- PMI — https://www.pmi.org/learning/thought-leadership/pulse/pulse-of-the-profession-2018
- kpmg — https://assets.kpmg.com/content/dam/kpmg/pdf/2009/12/Global-IT-Project-Management-Survey-0508.pdf
- PMI — https://www.pmi.org/learning/library/benefits-management-accelerate-value-delivery-5959
- ScienceDirect — https://www.sciencedirect.com/science/article/pii/S1687404815000103
- Taylor & Francis — https://www.taylorfrancis.com/chapters/edit/10.4324/9781315585741-20/benefits-realization-management-benefit-realization-management-brm-gerald-bradley
- McKinsey & Company — https://www.mckinsey.com/capabilities/tech-and-ai/our-insights/delivering-large-scale-it-projects-on-time-on-budget-and-on-value
- McKinsey & Company — https://www.mckinsey.com/~/media/mckinsey/dotcom/client_service/corporate%20finance/mof/pdf%20issues/pdfs%20issue%2045/final/mof45_largescaleit.ashx
- McKinsey & Company — https://www.mckinsey.com/~/media/McKinsey/dotcom/client_service/BTO/PDF/MOBT_27_Delivering_large-scale_IT_projects_on_time_budget_and_value.ashx
- McKinsey & Company — https://www.mckinsey.com/~/media/McKinsey/Business%20Functions/McKinsey%20Digital/Our%20Insights/Delivering%20large%20scale%20IT%20projects%20on%20time%20on%20budget%20and%20on%20value/Delivering%20large%20scale%20IT%20projects%20on%20time%20on%20budget%20and%20on%20value.pdf
- ResearchGate — https://www.researchgate.net/publication/285851331_Delivering_large-scale_IT_projects_on_time_on_budget_and_on_value
- McKinsey & Company — https://www.mckinsey.com/capabilities/mckinsey-digital/our-insights/achieving-success-in-large-complex-software-projects
- McKinsey & Company — https://www.mckinsey.com/capabilities/mckinsey-digital/how-we-help-clients/it-project-optimization
- McKinsey & Company — https://www.mckinsey.com/capabilities/transformation/our-insights/why-do-most-transformations-fail-a-conversation-with-harry-robinson
- PR Newswire — https://www.prnewswire.com/news-releases/companies-can-flip-the-odds-of-success-in-digital-transformations-from-30-to-80-301162310.html
- Consulting.us — https://www.consulting.us/news/5575/study-of-900-digital-transformations-only-30-are-successful
- Bcgplatinion — https://www.bcgplatinion.com/insights/why-70-of-transformations-miss-the-mark-and-how-to-fix-them
- BCG — https://www.bcg.com/publications/2024/wheres-value-in-ai
- ReinsuranceNe.ws — https://www.reinsurancene.ws/bcg-reveals-74-of-companies-face-challenges-in-unlocking-ai-value/
- Bain & Company + 3 — https://www.bain.com/insights/soul-searching-true-transformations-start-within/
- arxiv +3 — https://arxiv.org/pdf/1304.0265
- 15minutebusinessbooks — https://www.15minutebusinessbooks.com/blog/2023/04/18/how-big-things-get-done-the-surprising-factors-that-determine-the-fate-of-every-project-from-home-renovations-to-space-exploration-and-everything-in-between-by-bent-bfvbjerg-here-are-my-seven-less/
- Amazon — https://www.amazon.com/How-Big-Things-Get-Done/dp/0593239512
- Semanticarts — https://www.semanticarts.com/data-centric-how-big-things-get-done-in-it/
- strategy+business — https://www.strategy-business.com/article/Why-do-large-projects-go-over-budget
- arxiv — https://arxiv.org/pdf/2210.01573
- PwC Suisse — https://www.pwc.ch/en/insights/risk/are-large-scale-transformation-initiatives-doomed-by-default.html
- Deloitte — https://www.deloitte.com/global/en/issues/digital/measurements-that-matter-for-calculation-digital-transformation-roi.html
- Accenture — https://www.accenture.com/us-en/services/technology-transformation
- LevelTen + 3 — https://getlevelten.com/wiki/chaos-report
- Henny Portman's Blog — https://hennyportman.wordpress.com/2020/01/03/review-chaos-report-2018/
- Grokipedia + 3 — https://grokipedia.com/page/Standish_Group_CHAOS_reports
- SpendArk + 2 — https://spendark.com/blog/state-of-cloud-waste-2026/
- Flexera — https://www.flexera.com/about-us/press-center/new-flexera-report-finds-84-percent-of-organizations-struggle-to-manage-cloud-spend
- Gartner — https://www.gartner.com/peer-community/oneminuteinsights/omi-keeping-cloud-costs-check-it-leader-perspectives-rfz
- IBM — https://www.ibm.com/think/insights/increasing-cloud-costs-cio-guide
- Medium — https://medium.com/@sohail_saifi/why-your-cloud-migration-is-secretly-costing-3x-more-than-you-think-d5d6ccd14bd3
- Interactive — https://www.interactive.com.au/insights/cloud-financial-planning-avoid-bill-shock/
- Cloudian — https://cloudian.com/blog/500-billion-in-lost-market-value-vc-firm-estimates-impact-of-public-cloud-costs/
- McKinsey & Company — https://www.mckinsey.com/capabilities/tech-and-ai/our-insights/in-search-of-cloud-value-can-generative-ai-transform-cloud-roi
- McKinsey & Company — https://www.mckinsey.com/capabilities/mckinsey-digital/our-insights/ending-the-confusion-in-cloud-transformations-the-dashboards-and-metrics-everyone-needs
- The FinOps Foundation — https://www.finops.org/framework/previous-capabilities/forecasting/
- Finops — https://data.finops.org/2025-report/
- CloudZero — https://www.cloudzero.com/blog/state-of-finops-2025/
- ProsperOps — https://www.prosperops.com/blog/our-take-on-the-2024-state-of-finops-report/
- U.S. GAO — https://www.gao.gov/products/gao-19-58
- Nextgov.com — https://www.nextgov.com/modernization/2022/09/federal-agencies-still-face-several-cloud-challenges-watchdog-says/377854/
- arXiv — https://arxiv.org/abs/2302.06590
- arXiv — https://arxiv.org/abs/2507.09089
- METR — https://metr.org/blog/2025-07-10-early-2025-ai-experienced-os-dev-study/
- arxiv — https://arxiv.org/pdf/2602.20292
- Getdx — https://newsletter.getdx.com/p/metr-study-on-how-ai-affects-developer-productivity
- arxiv — https://arxiv.org/pdf/2507.09089
- ELEKS — https://eleks.com/blog/github-copilot-review-development-speed/
- Logisticsit — https://www.logisticsit.com/articles/2024/07/26/stack-overflow%E2%80%99s-2024-developer-survey-shows-the-gap-between-ai-use-and-trust-in-its-output-continues-to-widen-among-coders
- Stack Overflow — https://stackoverflow.blog/2026/02/18/closing-the-developer-ai-trust-gap/
- Stack Overflow — https://survey.stackoverflow.co/2025/
- Google Cloud + 2 — https://cloud.google.com/blog/products/devops-sre/announcing-the-2024-dora-report
- DX — https://getdx.com/blog/2024-dora-report/
- Google + 2 — https://blog.google/innovation-and-ai/technology/developers-tools/dora-report-2025/
- Atlassian + 2 — https://www.atlassian.com/blog/developer/developer-experience-report-2024
- GitClear — https://www.gitclear.com/coding_on_copilot_data_shows_ais_downward_pressure_on_code_quality
- Jonas — https://www.jonas.rs/2025/02/09/report-summary-gitclear-ai-code-quality-research-2025.html
- GitClear — https://www.gitclear.com/ai_assistant_code_quality_2025_research
- Medium — https://medium.com/@steve.fenton/whats-missing-with-ai-generated-code-refactoring-0c9f45a3fd6a
- ShiftMag — https://shiftmag.dev/mckinsey-measure-developer-productivity-1166/
- CodePulse — https://codepulsehq.com/guides/mckinsey-developer-productivity-response
- Microsoft + 2 — https://www.microsoft.com/en-us/research/publication/the-space-of-developer-productivity-theres-more-to-it-than-you-think/
- Open University — https://oro.open.ac.uk/11215/2/WardDanielPeppard_MISQE_FINALas_submitted_after_revisions.pdf
- Open University — https://oro.open.ac.uk/11227/2/Peppard-Ward-Daniel_BMc_edits_JW230307.pdf
- ResearchGate — https://www.researchgate.net/publication/42795451_Managing_the_realization_of_business_benefits_from_IT_investments
- SSRN + 2 — https://papers.ssrn.com/sol3/papers.cfm?abstract_id=2278359
- Taylor & Francis Online — https://www.tandfonline.com/doi/abs/10.1080/07421222.1994.11518050
- MIS Quarterly — https://misq.umn.edu/a-cross-cultural-study-on-escalation-of-commitment-behavior-in-software-projects.html
- Jeff Winter — https://www.jeffwinterinsights.com/insights/survivorship-bias
- Corejournals — https://llm.corejournals.org/llm/article/view/7287/6443
- PMI — https://www.pmi.org/learning/library/post-mortems-lessons-data-collected-7826
- Hraconsulting-ltd — https://www.hraconsulting-ltd.co.uk/post-implementation-review.htm
- ProjectManagement.com — https://www.projectmanagement.com/blog-post/73046/lessons-learned-from-lessons-learned
- Quay Consulting — https://www.quayconsulting.com.au/news/post-implementation-reviews-a-frontline-perspective/
- Projectmanagementformula — https://projectmanagementformula.com/project-lifecycle-post-implementation-review-guide/
- ResearchGate — https://www.researchgate.net/publication/220356619_The_politics_of_post-implementation_reviews
- Medium — https://medium.com/@tedislava.vasileva/cobit-2019-for-auditors-a-quick-guide-2d13974b2277
- Joe The IT Guy — https://www.joetheitguy.com/cobit-a-z/
- Mindmeshacademy — https://www.mindmeshacademy.com/certifications/itil/itil-4-foundation/study-guide/3-1-7-continual-improvement-practice
- Amazon UK — https://www.amazon.co.uk/Post-Project-Reviews-Effective-Lessons-Learned/dp/193389024X
- ePrints Soton — https://eprints.soton.ac.uk/47176/
- Gartner — https://www.gartner.com/en/newsroom/press-releases/2025-07-15-gartner-forecasts-worldwide-it-spending-to-grow-7-point-9-percent-in-2025
- Gartner — https://www.gartner.com/en/newsroom/press-releases/2026-02-03-gartner-forecasts-worldwide-it-spending-to-grow-10-point-8-percent-in-2026-totaling-6-point-15-trillion-dollars
- Gartner — https://www.gartner.com/en/documents/7096933
- IEEE Spectrum — https://spectrum.ieee.org/amp/it-management-software-failures-2674305315
- EurekAlert! — https://www.eurekalert.org/news-releases/1039233
- Clearwork — https://www.clearwork.io/blog-posts/why-most-digital-transformations-fail--and-how-to-get-yours-right
- Science — https://scienmag.com/2-3-trillion-wasted-globally-in-failed-digital-transformation-programs-costly-and-complex-business-strategies-are-not-necessary/
- Let's Data Science — https://letsdatascience.com/blog/developers-thought-ai-made-them-faster-the-data-said-otherwise
EDITORIAL BRIEF
Commissioned from our research desk. Subject to final editorial discretion.
How organizations consistently underinvest in the ability to actually evaluate whether a technical initiative worked after it shipped. Explore the gap between the business case used to fund a project and the follow-through on measuring real outcomes—latency improvements that never get re-benchmarked, cost savings that never appear in finance actuals, developer productivity gains that nobody instruments. Look into statistics on post-implementation review adoption rates in IT. Readers should recognize that without closing this loop, every future funding decision is based on vibes, not evidence.