The proof is indisputable.
Something has bothered me for years. I finally have the math to explain it.
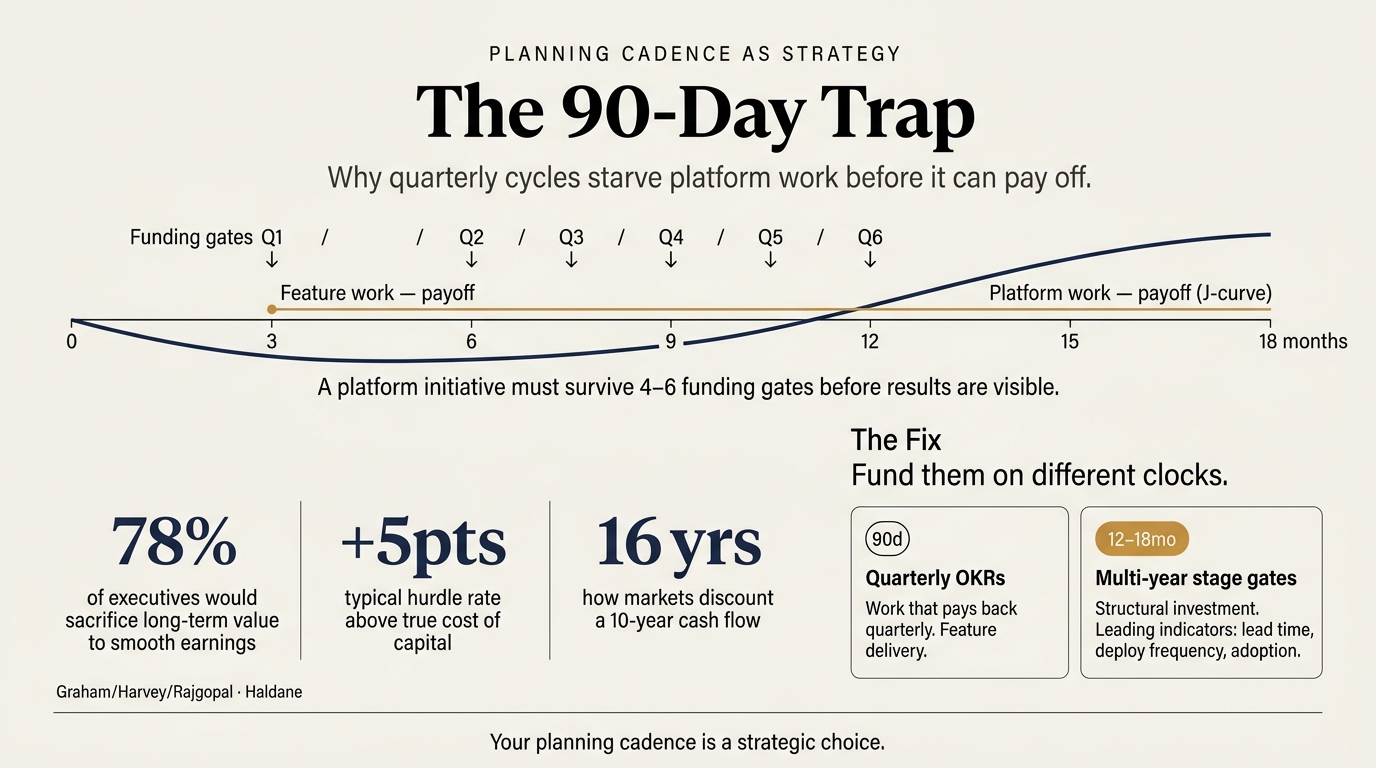
A serious platform or architecture initiative takes 12 to 18 months to show measurable results. That's the physics. You're changing how dozens of teams build, deploy, and operate software, and benefits show up as second-order effects across the org. The State of Platform Engineering survey found only about a third of platform teams can show measurable value inside 6 months, and roughly 40% still can't after 12. DORA calls this a J-curve.
Now add the planning cadence. Most companies plan in quarters. A platform initiative has to survive 4 to 6 consecutive funding decisions before any payoff is visible. At every gate, it competes against feature work whose revenue attribution is legible this quarter. Under any reasonable payback cutoff, the feature wins. Not because it has higher true NPV, but because its cash flows arrive sooner.
Graham, Harvey, and Rajgopal documented this at the CFO level in 2005: 78% of executives would sacrifice long-term economic value to smooth earnings, and 55% would walk away from a positive-NPV project to avoid missing a quarterly number. The same logic plays out inside the company, every time a platform roadmap gets re-litigated against feature requests. The org does to itself what the market does to it.
Capital allocation theory makes this worse. Hurdle rates in practice sit 5+ points above the actual cost of capital. Andrew Haldane estimated markets value 10-year cash flows as if they were 16+ years out. Long-duration work gets penalized mathematically, before anyone argues about its merits.
Almost nobody questions the cadence itself. Quarterly planning is roughly 100-year-old management technology. It conflates targets, forecasts, and resource allocation into one calendar event, and we treat the calendar as a law of nature. A quarterly measurement window quietly determines which strategies are even attemptable, because anything that can't show a result inside it gets starved.
Quarterly discipline exists for a reason. McKinsey and Oxford studied 5,400 large IT projects and found each additional year adds about 15% to cost overruns, with 17% becoming genuine disasters. Don't abolish accountability. Recognize that one cadence can't serve both feature delivery and structural investment, and fund them on different clocks. Quarterly OKRs for work that pays back quarterly. Multi-year commitments with evidence-based stage gates for work that doesn't. Leading indicators like lead time, deployment frequency, and adoption tracked from day one.
Your planning cadence is a strategic choice. You can change it. Until you do, your technical strategy operates inside a constraint that was never designed for it.
Why Quarterly Planning Structurally Defeats Technical Strategy: A Research Overview
TL;DR
- Meaningful platform/architecture initiatives typically take 12–18 months (and sometimes much longer) to show measurable value, but quarterly planning forces re-justification every ~90 days against feature work with immediate, legible revenue attribution — creating a structural mismatch of 4–6 funding decisions before payoff is visible.
- This is not just an engineering complaint: it is the same "managerial short-termism / corporate myopia" documented in corporate-finance research (Graham-Harvey-Rajgopal 2005; Haldane & Davies 2011; Asker-Farré-Mensa-Ljungqvist 2015), reinforced by capital-budgeting tools (high hurdle rates, short payback cutoffs) that mathematically penalize long-duration cash flows.
- The quarterly cadence is itself an unquestioned design choice (Goodhart's Law, Beyond Budgeting critique). But the discipline isn't irrational — large, long, checkpoint-free IT projects fail at high rates — so the defensible position is to protect long-horizon work with separate funding horizons (McKinsey Three Horizons) and stage-gated investment, not to abolish accountability.
Key Findings
1. The time-horizon mismatch is real and quantifiable
- Industry data converges on a 12–18 month window for platform/internal-developer-platform (IDP) investments to reach measurable ROI. The State of Platform Engineering Report Vol. 4 (2025, 518 practitioners, platformengineering.org, sponsored by Broadcom) found that only 35.2% of platform teams deliver measurable value within six months, while 40.9% cannot demonstrate measurable value within their first twelve months — leaving them, in the report's framing, "vulnerable to defunding or deprioritization."
- DORA's research describes a "J-curve": implementing a platform initiative often causes a temporary dip in performance (throughput/stability) before benefits materialize as the platform matures. DORA lead Nathan Harvey: "Platform engineering isn't about quick fixes... That takes time, iteration, and empathy for the user experience—your devs."
- Major re-platforming/migration efforts are multi-year. Netflix's cloud migration took ~7 years (Aug 2008 → Jan 2016, per Netflix's own "Completing the Netflix Cloud Migration" post), and its monolith-to-microservices decomposition alone ran ~2009–2011.
- Quarterly is the dominant planning cadence. The most popular OKR cadence is quarterly (90-day cycles); Google ran pure quarterly OKRs until 2011 before Larry Page added annual OKRs. This means a 12–18 month initiative must survive 4–6 consecutive quarterly funding/justification decisions before any payoff is visible. [1][2]
2. Revenue attribution asymmetry
- Feature work has immediate, legible revenue attribution; platform/infrastructure returns are diffuse, delayed, and hard to attribute. The State of Platform Engineering report found that nearly 30% of platform teams do not measure success at all (an improvement from 45% in 2024), and frames platform work without metrics as "faith rather than engineering."
- The cost of illegibility is concrete: the average developer spends 17.3 of a 41.1-hour week (≈42%) on maintenance, per Stripe's "The Developer Coefficient" (2018, Harris Poll, 1,000+ developers across US/UK/France/Germany/Singapore) — broken down as 13.5 hours/week on technical debt and 3.8 hours/week on "bad code" specifically, totaling "nearly $85 billion worldwide in opportunity cost lost annually." Platform work is precisely the kind of investment that reduces this toil, but its return is distributed across many teams over time.
- Technical-debt research quantifies the drag directly: Besker, Martini & Bosch (2019), "Software developer productivity loss due to technical debt" (Journal of Systems and Software, vol. 156, pp. 41–61; longitudinal study of 43 developers + 16 practitioner interviews) found "developers waste, on average, 23% of their development time due to TD and...are frequently forced to introduce new TD due to already existing TD." McKinsey's Developer Velocity Index (2020, 440 enterprises) found top-quartile companies grew revenue 4–5x faster and had 60% higher shareholder returns — but these are exactly the kinds of returns that do not show up in a single quarter.
3. Capital-allocation theory: the math is biased against long horizons
- Graham, Harvey & Rajgopal (2005), "The Economic Implications of Corporate Financial Reporting" (Journal of Accounting and Economics; surveyed 401 CFOs + interviewed ~20): 78% of executives would sacrifice long-term economic value to smooth earnings, and 55% would avoid initiating a positive-NPV project if it meant missing the current quarter's consensus earnings. One CFO described forgoing two of four valuable long-term projects purely to protect near-term targets. [3]
- Payback period & hurdle rates structurally penalize long-duration work. The payback rule ignores all cash flows after the cutoff, creating "a systematic bias toward short-term projects." Ian M. Dobbs, "How bad can short termism be?" (Management Accounting Research, Vol. 20, No. 2, 2009) documents that hurdle rates are "typically set significantly higher than the firm's cost of capital, with rates often 5% or more above conventional estimates," combined with "additional short payback thresholds of 2–4 years" — decision rules that mechanically reject value-creating long-horizon projects. [4]
- Hyperbolic discounting / "excess discounting": Andrew Haldane & Richard Davies (Bank of England, 2011, "The Short Long," ~600 UK/US firms 1980–2009) found statistically significant evidence that markets over-discount future cash flows. Under their myopia estimate, cash flows lose >99% of their value within 25 years, versus retaining >1% even 50 years out under rational discounting: "long-duration cash-flows and projects are penalised particularly severely." Haldane's estimate is that markets value 10-year-ahead cash flows as if they were 16+ years out. [5]
- Public vs. private "natural experiment": Asker, Farré-Mensa & Ljungqvist (2015, Review of Financial Studies) found private firms invest nearly twice as much as comparable public firms and are >4x more responsive to investment opportunities — consistent with public-market short-termism raising the effective hurdle rate. The authors conclude public firms "invest myopically." [6]
- "Quarterly capitalism": Dominic Barton (McKinsey, 2011) coined the critique. The 2013 McKinsey & Canada Pension Plan Investment Board (CPPIB) survey of 1,000+ board members/C-suite executives (reported in "Focusing capital on the long term," Barton & Wiseman) found: "Sixty-three percent of respondents said the pressure to generate strong short-term results had increased over the previous five years... Eighty-six percent declared that using a longer time horizon to make business decisions would positively affect corporate performance."
- Real options (Dixit & Pindyck, 1994, Investment Under Uncertainty) offers an alternative valuation lens: long-horizon platform investments under uncertainty carry option value (to expand, delay, or abandon) that naive single-point NPV/payback ignores — in their framing, "The simple NPV rule is not just wrong; it is often very wrong." [7]
4. The cadence as an unquestioned strategic constraint
- Goodhart's Law (Charles Goodhart, 1975; popularized by Marilyn Strathern as "when a measure becomes a target, it ceases to be a good measure"): a quarterly measurement cadence shapes which strategies are even attemptable. Work that can't show a result inside the measurement window gets systematically deprioritized.
- Beyond Budgeting (Bjarte Bogsnes, who led implementation at Borealis and Statoil/Equinor): the annual/quarterly budget is a ~100-year-old management technology that conflates three different things (targets, forecasts, and resource allocation) and forces calendar-driven decisions ("the budget bank is open once a year only, and unspent budget funds are lost"). The core critique: the cadence is a design choice, rarely questioned.
- Critiques of quarterly OKRs: practitioners note quarterly cycles are "painfully long when you need feedback" but too short for strategic goals, and they incentivize framing work as shippable features/projects rather than outcomes (e.g., "Launch mobile feature X by Q3" instead of "increase conversion 15%"). John Cutler: "We seem to take the quarterly OKR as gospel, and all gospels should be challenged."
- Amazon / Bezos: the clearest counter-model. Bezos's 1997 letter ("a fundamental measure of our success will be the shareholder value we create over the long term") and his recurring line that Amazon is "willing to be misunderstood for long periods of time" (repeated as recently as the 2025 shareholder letter). AWS itself was an internal-infrastructure bet — "No one asked for AWS" — that became a business.
5. Counter-evidence and nuance (the discipline isn't irrational)
- Long, checkpoint-free projects genuinely fail. McKinsey + University of Oxford (5,400+ IT projects, 2012): large IT projects (>$15M) run 45% over budget, 7% over time, and deliver 56% less value than predicted; 17% become "black swans" with >200% overruns that can "threaten the very existence of the company." Crucially, each additional year increases cost overruns by ~15% — so project duration itself is a risk factor. This is the strongest argument for regular checkpoints. [8][8]
- The defensible synthesis is structural separation, not abolition of accountability. McKinsey's Three Horizons model (Baghai, Coley & White, The Alchemy of Growth, 1999) explicitly calls for running H1 (core), H2 (emerging), and H3 (future options) in parallel with different metrics, funding, and governance — warning that applying H1's "execute and incrementally improve" logic everywhere starves long-horizon work. [9]
- Practical mechanisms that make long bets work inside quarterly structures: ring-fenced/protected funding lines, stage-gated investment tied to evidence (not calendar), separate "investment" budget categories, and treating the platform as an internal product with leading-indicator metrics (DORA, adoption) rather than quarterly revenue.
Details
The structural "math" walkthrough: If results take 12–18 months (4–6 quarters) but the initiative must re-justify against features with immediate revenue attribution every 90 days, the platform team faces 4–6 funding decisions before payoff is visible. At each gate it competes against work whose ROI is legible this quarter. Under any positive discount rate and short payback cutoff, the feature wins the gate — even when the platform has higher true NPV — because (a) its cash flows arrive sooner and (b) its attribution is cleaner. This is the organizational-process mirror of the Graham-Harvey-Rajgopal finding at the firm level: the same logic that makes 55% of CFOs skip a positive-NPV project to hit a quarter operates inside the company every time a platform roadmap is re-litigated against feature requests.
Why attribution asymmetry compounds the problem: Feature revenue is directly countable; platform value shows up as second-order effects (faster lead times, fewer incidents, lower attrition, avoided cost) distributed across many teams over time. DORA metrics (deployment frequency, lead time, change failure rate, MTTR) are the standard proxies — the most widely adopted framework (40.8% of teams in the Vol. 4 report) — but they are leading indicators, not quarterly revenue, so they lose to feature P&L in a quarterly bake-off.
On discount rates and payback: The combination of (1) hurdle rates set above cost of capital (Dobbs: often 5%+ above), (2) short payback thresholds (Dobbs: 2–4 years), and (3) hyperbolic/excess discounting (Haldane) means an organization's effective time preference is far steeper than financial theory would justify. Haldane's empirical estimate — markets value 10-year cash flows as if they were 16+ years out — quantifies exactly how much the "long" gets shortened.
Recommendations
- Reframe the platform business case in the finance department's own language. Present NPV and payback, but explicitly show the value destroyed by the short payback cutoff (cite Graham-Harvey-Rajgopal 2005 and Dobbs 2009). Use real-options framing for genuinely uncertain bets. Benchmark to change: if finance won't fund below a given payback, negotiate a separate hurdle for infrastructure (a "7-year cutoff for infrastructure vs. 3-year for features" is a recognized practice). [4]
- Decouple the funding horizon from the planning cadence. Adopt a Three Horizons split: keep quarterly OKRs for H1 feature delivery, but fund platform/architecture as a protected H2/H3 line with annual or multi-year commitment and stage-gated (evidence-based) reviews rather than quarterly re-justification.
- Instrument leading indicators from day one. The data is unambiguous that teams which measure early survive: 35.2% prove value within 6 months, while the 40.9% who can't show value within 12 months get defunded. Stand up DORA + adoption + toil-hours-saved metrics (anchored to the Stripe 17.3 hours/week and Besker et al. 23% baselines) before launch to convert "faith" into evidence.
- Time-box and checkpoint to respect the legitimate risk. Because each additional year raises overrun risk ~15% and 17% of large IT projects become black swans, structure the initiative as a sequence of 90-day deliverables with kill/continue gates — preserving accountability while protecting the multi-quarter arc. This directly addresses the strongest pro-quarterly argument rather than dismissing it.
- Benchmarks that should change the plan: If after two quarters there is no movement on at least one leading indicator (lead time, deployment frequency, adoption), treat that as a genuine signal to course-correct or stop — the quarterly discipline is doing its job. Conversely, if leading indicators are improving but revenue attribution lags, that is the expected J-curve and is not a reason to defund.
Caveats
- Vendor-sourced numbers: Many platform-engineering ROI figures circulating online (e.g., "600–800% ROI," specific deployment-frequency gains) come from vendor/consultancy blogs and sponsored content and should be treated as directional marketing, not peer-reviewed evidence. The State of Platform Engineering survey figures (35.2% / 40.9% / ~30% don't measure) are more defensible because they describe distributions of practitioner experience, but the report is Broadcom-sponsored, and secondary coverage rendered the "don't measure" figure as "nearly 30%" rather than a confirmed exact decimal.
- The 12–18 month figure is an industry heuristic, not a precisely measured constant; actual time-to-value varies widely by org size, scope, and approach (MVP vs. "big bang").
- Short-termism evidence is debated. Some economists (e.g., commentary citing Larry Summers on GM as a "poster child of long-term thinking" that still failed) note long-term strategies also fail and that the payout-vs-investment causation is unclear. The Graham-Harvey-Rajgopal and Asker et al. findings are robust, but the macro "quarterly capitalism is destroying the economy" claim is contested.
- Goodhart/Beyond Budgeting critiques are largely qualitative/theoretical, not RCT-tested; they are useful framing devices, not hard proof.
- Correlation vs. causation: McKinsey DVI and DORA results show association between tooling/platform maturity and performance; the causal direction (good companies invest vs. investment makes companies good) is not fully established.
- What Matters — https://www.whatmatters.com/okrs-explained/okr-timeframe
- Perdoo — https://www.perdoo.com/resources/blog/okr-cadence
- Columbia Business School — https://business.columbia.edu/sites/default/files-efs/pubfiles/12924/Rajgopal_value.pdf
- Ryan O\'Connell, CFA — https://ryanoconnellfinance.com/payback-period/
- Global Banking and Finance + 2 — https://www.globalbankingandfinance.com/the-short-long-paper-by-andrew-haldane-and-richard-davies/
- NYU Stern — https://www.stern.nyu.edu/experience-stern/faculty-research/asker-ljungqvist-public-firms
- ScienceDirect — https://www.sciencedirect.com/topics/computer-science/real-option-theory
- McKinsey & Company — https://www.mckinsey.com/capabilities/tech-and-ai/our-insights/delivering-large-scale-it-projects-on-time-on-budget-and-on-value
- Digital Leadership — https://digitalleadership.com/unite-articles/three-horizons-of-growth/
Commissioned from our research desk. Subject to final editorial discretion.
How quarterly planning cycles structurally prevent technical strategy from working. Walk through the math on how a meaningful platform or architecture initiative takes 12-18 months to show measurable results, but has to re-justify its existence every 90 days against features with immediate revenue attribution. Look into how capital allocation theory treats long-duration investments versus short-cycle ones. The reader should recognize that the planning cadence itself is a strategic constraint most orgs never question.