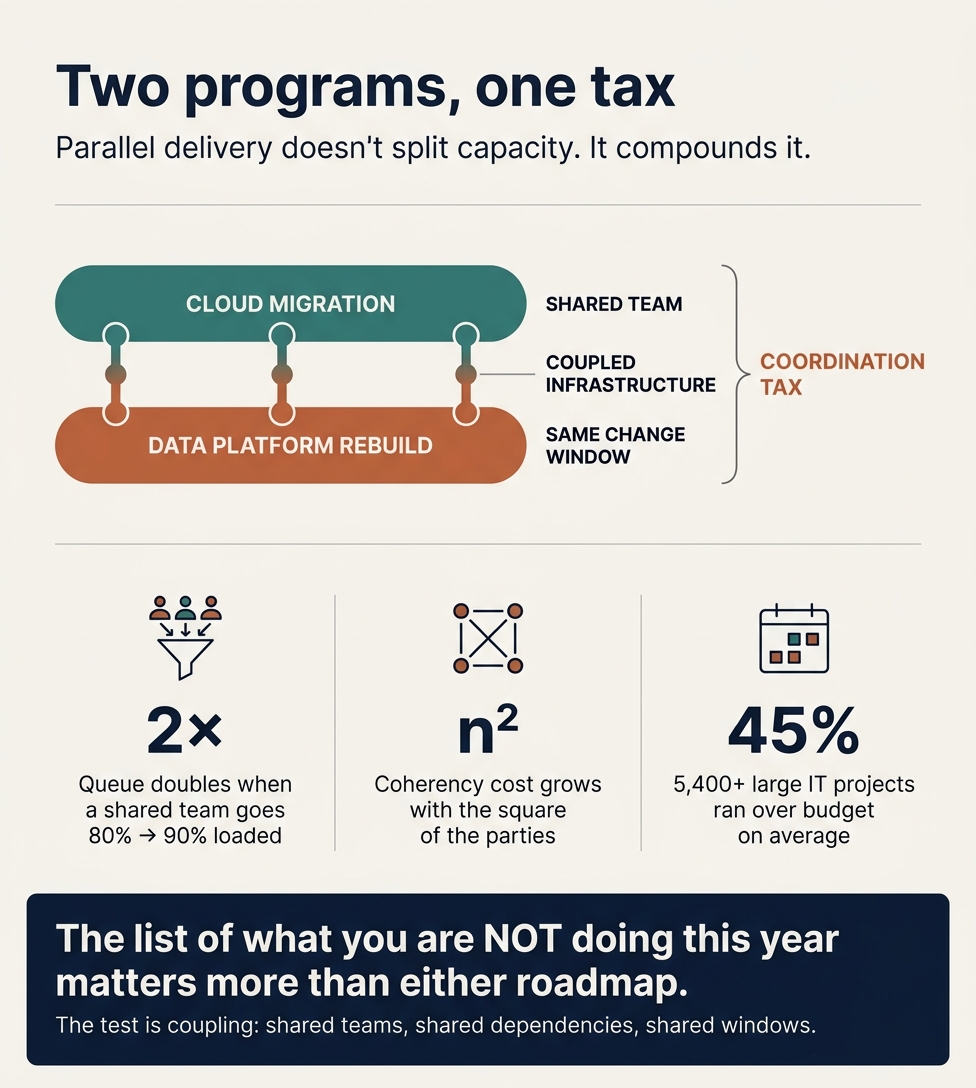
Most portfolio plans assume running two big programs at once costs you division. Half the platform team on the cloud migration, half on the data platform rebuild, both slower but both moving. That arithmetic breaks in month seven, when everyone asks why two individually competent teams are collectively late.
The cost is division plus a coordination tax that grows faster than the work itself.
Three things produce it. First, the shared team. Both programs lean on the same few people who understand the network, the identity model and the deployment pipeline. Queueing theory is precise here: wait time scales with utilisation over one minus utilisation, so a shared team going from 80% to 90% loaded roughly doubles the queue, and 90 to 95 doubles it again. Nobody is idle, and everything downstream waits.
Second, coupled infrastructure. When the data platform depends on network topology the migration is actively changing, you no longer have two programs. You have one, with two plans and no owner. Gunther's scalability model names the second cost: coherency, the price of keeping everyone consistent, which grows with the square of the parties because agreement is pairwise. Past a point, adding concurrency makes throughput fall.
Third, the change window. Two programs competing for scarce production slots bundle changes into bigger, rarer, riskier batches, the pattern that correlates with higher failure rates. Governance does not save you: DORA found external approvals negatively correlated with lead time and deployment frequency, and uncorrelated with change failure rate. You pay for the coordination and do not get the safety.
TSB is the cleanest illustration I know. Five million customers cut onto a new platform while nearly every other system was replaced: two unproven architectures in one weekend. £48.65m in fines, £32.7m in redress, over £300m total cost, and the CIO personally fined. Every piece had a plan. The portfolio did not.
A note on evidence, since this topic attracts bad numbers. The McKinsey and Oxford study of 5,400+ large IT projects found 45% over budget on average, 56% less value than predicted, and every extra year adding about 15% to the overrun. Running two programs at once makes both longer, and both more expensive.
None of which means always sequence. Sometimes parallel is right: modernising your data estate during a migration avoids doing the work twice and rebuilding legacy constraints somewhere new. The test is coupling. Do they share teams, share infrastructure dependencies, compete for the same change windows? Two or three, interleave or sequence. None, run them together.
The list of what you are not doing this year matters more than either roadmap. Most of us can plan one hard thing well. Far fewer write down what we are deliberately holding back, and that is usually where the schedule was lost.
The compounding coordination tax of running two major technical initiatives in parallel
TL;DR
- Running a cloud migration and a data platform rebuild at the same time does not just split engineering capacity in half; it adds a coordination cost that grows faster than the work itself, because shared teams, shared infrastructure, and shared change windows all interact. The best-supported mechanism is Neil Gunther's Universal Scalability Law, whose "coherency" term makes throughput actually fall past a certain level of concurrency, not just plateau.
- The strongest, most defensible evidence for the thesis comes from queueing theory (Kingman's formula), the DORA/Accelerate research on coordination and approvals, and the McKinsey-Oxford dataset on large IT projects. The weakest and most contestable numbers are the Standish CHAOS figures, the "70% of transformations fail" claim, and the "85% of AI/data projects fail" claim, all of which are poorly sourced folklore.
- The takeaway holds, with one important refinement: the decision of what NOT to run concurrently often matters more than either roadmap, but the right frame is not "always sequence." It is "decompose into small, independently deliverable modules and limit work in progress." Bent Flyvbjerg's data supports fast modular delivery over big-bang efforts, whether serial or parallel.
Key Findings
- Coordination overhead scales roughly with the square of the number of people and teams who must agree, per Brooks's n(n-1)/2 communication-path formula. Two programs sharing teams multiply the paths that must stay coherent.
- The Universal Scalability Law is the strongest theoretical fit for a "compounding" tax: its coherency term (beta) can push throughput down past an optimum, giving negative returns to added concurrency.
- Queueing theory (Kingman's formula) shows wait time explodes non-linearly as any shared resource (a platform team, a DBA pool, a change window) approaches full utilisation. Going from 80% to 90% utilisation roughly doubles the queue; 90% to 95% doubles it again.
- The DORA/Accelerate research found external approvals slow delivery with no improvement in change-failure rate, which is direct evidence that the coordination machinery you bolt on to manage competing changes does not buy safety.
- Named academic work on multi-project settings (Engwall and Jerbrant's "resource allocation syndrome"; Zika-Viktorsson's "project overload") identifies concurrency itself as the prime failure mode of multi-project organisations.
- The hard delivery data (McKinsey-Oxford, 5,400+ projects) is solid; the folklore data (Standish, "70% fail", "85% of data projects fail") is not, and a post should lean on the former.
Details
1. Multi-program vs single-initiative delivery data
McKinsey-Oxford, "Delivering large-scale IT projects on time, on budget, and on value" (2012). This is the anchor number and it is solid. Working with the BT Centre for Major Programme Management at the University of Oxford, McKinsey analysed more than 5,400 IT projects with initial budgets above $15 million. On average these projects ran 45% over budget and 7% over time while delivering 56% less value than predicted. Every additional year on a project increased cost overruns by an average of 15%. Roughly 17% became "black swans" with cost overruns of 200% to 400% that threatened the company's existence. Trustworthiness: high. Large sample, named academic partner, widely replicated. One caveat worth flagging: the widely repeated "$66 billion" figure is the total overrun across that specific sample, not an annual or global loss, and is often misquoted as a recurring figure. [1]
Flyvbjerg and Budzier, Harvard Business Review (2011). A companion study of 1,471 IT projects found an average cost overrun of 27%, but with a fat tail: one in six projects was a black swan with a cost overrun of 200% on average and a schedule overrun of almost 70%. Trustworthiness: high. Peer-recognised, primary. The practical lesson is that big IT bets carry catastrophic tail risk, which argues for breaking work into small modules rather than running giant efforts of any kind.
The academic literature on multi-project overload is the most on-point evidence, and it is under-used in industry writing.
- Engwall and Jerbrant, "The resource allocation syndrome: the prime challenge of multi-project management?" International Journal of Project Management, 2003 (Vol. 21, No. 6, pp. 403-409). Based on qualitative case studies of two multi-project organisations, they argue the number-one recurring problem in organisations running many simultaneous projects is competition for shared resources, which forces continuous fire-fighting and short-term reallocation that damages other projects in the portfolio. They cite Clark and Wheelwright's "canary cage" image: new projects thrown into the cage without analysing the effect on the canaries already there. Trustworthiness: high for the mechanism, qualitative so no effect size.
- Zika-Viktorsson, Sundstrom and Engwall, "Project overload: an exploratory study of work and management in multi-project settings," International Journal of Project Management, 2006 (Vol. 24, pp. 385-394). This survey-based study links "project overload" (fragmentation and inefficiency from concurrent project assignments) to higher psychological stress reactions, decreased competence development, and deviations from time schedules. Trustworthiness: medium-high; it is the named source for a threshold effect on efficiency in multi-project work.
2. Cloud migration specific data
The cloud numbers are mixed quality, so treat them carefully.
- IDC repatriation research: per IDC's Cloud Pulse 4Q 2023 survey (IDC Blog, October 28, 2024), "close to half of cloud buyers spent more on cloud than they expected in 2023, with 59% anticipating similar overruns in 2024"; and per IDC's Server and Storage Workloads Survey, "only 8-9% of companies plan full workload repatriation." Trustworthiness: medium-high, named vendor-analyst survey.
- Gartner: predicts continued strong public cloud growth. Per Gartner's November 19, 2024 press release, "worldwide end-user spending on public cloud services is forecast to total $723.4 billion in 2025, up from $595.7 billion in 2024" (a 21.5% rise). Gartner explicitly calls widespread repatriation a "false narrative" driven by on-premises vendors, which is a useful corrective to the "everyone is fleeing the cloud" story. Trustworthiness: high as expert opinion, though the underlying data is behind a paywall.
- Gartner also estimates more than 25% of cloud spend is waste, and that "organizations without cloud optimization processes will overspend by 40%" (a separate 2023 Gartner survey put average cloud waste at 35%, ranging from 15% in highly optimised environments to 55% with no optimisation).
- An IDC-attributed figure widely cited says 38% of migrations exceed their original budget with an average overrun of 23%, and 31% miss their planned timeline, with legacy-application complexity the top cause. Trustworthiness: medium; the number circulates on aggregator sites and I could not confirm it against a primary IDC document.
The most useful strategic point on cloud comes from McKinsey's cloud-value work: the bulk of cloud's financial value comes from business-domain modernisation and refactoring, not from moving workloads. Pure lift-and-shift leaves most of the value on the table. McKinsey recommends aligning the migration schedule with major application upgrades. This matters for the thesis because it is the strongest argument that some parallelism is correct: doing modernisation during migration can avoid doing the work twice.
Here is where folklore dominates, and a careful post should say so.
- The "85% of big data / AI projects fail" and "80% never make it past pilot" claims trace back to Gartner predictions from around 2017 to 2019 (for example, a 2017 Gartner statement that 60% of big data projects fail to move past preliminary stages, later informally repeated as 85%). These are analyst predictions, not measured outcomes, and the exact figure drifts between 60%, 80%, 85% and 95% depending on who is repeating it. Trustworthiness: low as hard data. Use as illustrative sentiment only.
- More recent and better-defined: Gartner (February 2025) predicts organisations will abandon 60% of AI projects unsupported by AI-ready data through 2026, and a Q3 2024 Gartner survey of 248 data-management leaders found 63% either lack or are unsure they have the right data-management practices for AI. RAND Corporation's study (Ryseff and Narayanan, "The Root Causes of Failure for AI Projects," 2024, based on interviews with 65 experienced data scientists and engineers) states: "By some estimates, more than 80 percent of AI projects fail—twice the rate of failure for information technology projects that do not involve AI." Trustworthiness: medium; named and recent, but "fail" is defined loosely and the 80% is itself flagged as "some estimates," not RAND's own measurement.
- The recurring theme across these is that data foundations, not models, are the usual failure point, which is exactly the kind of shared dependency a concurrent cloud migration disrupts.
4. The mechanics and theory of coordination overhead
This is the heart of the argument and the best-sourced section.
Brooks's Law and the communication-path formula. From Fred Brooks, The Mythical Man-Month (1975): "Adding manpower to a late software project makes it later." The number of communication paths among n people is n(n-1)/2. Five people have 10 paths; 15 people have 105; 50 people have 1,225. So doubling the people involved in coordinating two programs roughly quadruples the paths that have to stay aligned. Brooks himself called the law an "outrageous oversimplification," and critics (notably around open-source projects) note it assumes everyone must talk to everyone. That caveat is itself the point: the tax only explodes when work is tightly coupled, which is precisely what concurrent programs sharing infrastructure create.
Amdahl's Law and the Universal Scalability Law (USL). This is the strongest theoretical fit for "compounding coordination tax," and worth stating precisely. Neil Gunther's USL gives the relative capacity of a system as:
C(N) = N / (1 + α(N − 1) + βN(N − 1))
where N is the number of workers/processes, α (alpha) is the contention term (queueing for shared resources), and β (beta) is the coherency term (the cost of keeping everyone consistent, which requires pairwise agreement and so grows with N(N−1), i.e. quadratically). When β = 0 the model reduces to Amdahl's Law, where throughput plateaus. When β is greater than 0, throughput rises, peaks, and then actually falls as N increases. That downturn, negative returns from adding concurrency, is the mathematical signature of a compounding tax rather than a simple split of capacity. Gunther originally developed the USL for tightly coupled multiprocessors in 1993; it has since been applied by analogy to organisations, where "getting pairwise agreement between every two parties" is the coherency penalty and decision-making "grinds to a halt" as the number of stakeholders per decision grows. Trustworthiness: high as a model; the organisational application is an analogy, not a measured fit, and should be presented that way.
Kingman's formula (the VUT equation) and utilisation. John Kingman (1961), "The single server queue in heavy traffic." The mean wait in a G/G/1 queue is approximately:
Wq ≈ (ρ / (1 − ρ)) × ((ca² + cs²) / 2) × τ
where ρ is utilisation, ca and cs are the coefficients of variation of arrivals and service, and τ is mean service time. The ρ/(1−ρ) term is the killer: at 80% utilisation the factor is 4; at 90% it is 9; at 95% it is 19. So pushing a shared team from 80% to 90% loaded roughly doubles the queue, and 90% to 95% doubles it again. Two programs both leaning on the same platform, SRE or DBA team drive that team's utilisation toward 100%, which is exactly where wait times go vertical. Donald Reinertsen's The Principles of Product Development Flow (2009) applies this directly to product development, arguing that invisible, unmanaged queues are the root cause of poor performance and that operating above roughly 80% utilisation produces disproportionately growing queues. He observes that many development processes run above 98% utilisation and then wonder why everything is late. Trustworthiness: high; Kingman is a primary mathematical result and Reinertsen is the standard reference for applying it to development.
Little's Law and WIP. Little's Law (cycle time = work in progress / throughput) means that, for a given throughput, cycle time rises linearly with the amount of work in progress. Running two big programs concurrently is, at the portfolio level, simply raising WIP, which lengthens the time to finish anything. This is the theoretical basis for "stop starting, start finishing." Trustworthiness: high; Little's Law is a proven queueing theorem.
Context switching and multitasking. Gerald Weinberg's Quality Software Management: Systems Thinking (1992), page 284, is the origin of the widely cited table: one project = 100% of time available; two projects = 40% each and 20% lost to switching; three = 20% each and 40% lost; and by five projects roughly 75% is lost to switching. Trustworthiness: this is a heuristic illustration, not empirical data, and Weinberg presented it as such; several practitioners note the loss is not truly linear. Use it as a vivid model, not a measured fact.
Gloria Mark's interruption research at UC Irvine is the other famous number, and it needs a careful health warning. The "23 minutes and 15 seconds to get back to a task" figure is real but does not come from her main peer-reviewed paper. Her 2008 study "The Cost of Interrupted Work: More Speed and Stress" actually found interrupted workers completed tasks slightly faster but with more stress and effort; the 23-minute figure comes from her interviews and follow-up analyses, not that paper, and it measures time to return to the original task (often via a chain of intervening tasks), not time to regain deep focus. Her later work reports average attention on a screen falling from about 2.5 minutes (2004) to about 47 seconds (2023). Trustworthiness: the underlying research is solid, but the specific "23:15" stat is widely misattributed and should be cited with that caveat.
Dependencies and delivery performance (DORA/Accelerate). The DevOps Research and Assessment program (Forsgren, Humble, Kim; Accelerate, 2018, and annual State of DevOps reports) consistently finds that loosely coupled architecture and loosely coupled teams are among the strongest predictors of software delivery performance. The 2021 DORA report found elite teams who meet reliability targets are about three times more likely to have a loosely coupled architecture than low performers. The key mechanism: when architecture and teams are loosely coupled, teams need little communication to get work done; when tightly coupled, "anyone working in one part of the system must constantly coordinate with anyone else," including navigating bureaucratic change processes. Crucially, Accelerate found that external approvals were negatively correlated with lead time and deployment frequency and had no correlation with change-fail rate. That is a direct, high-quality data point for the thesis: the coordination and approval machinery you add to manage competing changes slows you down without making you safer. Trustworthiness: high; large multi-year sample (tens of thousands of respondents across the program's life).
Team Topologies (Skelton and Pais, 2019). Introduces cognitive load as a first-class constraint and defines three interaction modes (collaboration, X-as-a-service, facilitating). Its central claim is that a team has a finite cognitive load, and that when you exceed it (for example by asking one platform team to serve two major programs at once) delivery slows. It is a qualitative framework rather than a source of hard effect sizes, so cite it for vocabulary and the cognitive-load concept, not for statistics.
The Rally / Broadcom "Impact of Agile Quantified" study. Based on non-attributable data from teams on the Rally platform (the report headline cites 9,629 teams, with individual charts drawing on tens of thousands of data points). It found that dedicating people to a single team roughly doubles throughput compared with teams less than 50% dedicated, and that high team stability (membership stable over about 90%) improves productivity, quality and time-to-market substantially. It also found team stability is generally poor, with about a quarter of members changing every three months. Trustworthiness: medium-high; very large sample, but it is a vendor dataset and the definitions are the vendor's.
5. Change management windows and freeze conflicts
DORA change-failure-rate benchmarks are the cleanest hard data. In the 2024 State of DevOps report, elite performers keep change failure rate around 5% (the tier band is often quoted as 0-15%), while low performers sit far higher (commonly quoted at 40% or more, with some breakdowns putting the lowest tier at 45-60%). The general DORA finding is that small, frequent, reversible changes reduce risk, while large batched changes increase it. This is directly relevant to concurrent programs: when two programs compete for scarce production change windows, they are forced to bundle changes into larger, less frequent batches, which is exactly the pattern DORA associates with higher failure and rework rates. DORA has recently added a "rework" or "failed deployment recovery" lens that captures unplanned change fallout.
The honest caveat: ITIL doctrine (change freezes, change advisory boards, change calendars to prevent conflicting changes) universally asserts that concurrent and colliding changes cause incidents, but I did not find a rigorous quantitative study measuring the incident-rate increase from concurrent programs competing for change windows. The DORA approval finding is the best empirical proxy. Flag this as a genuine evidence gap rather than presenting a specific collision statistic as established.
6. Shared infrastructure and platform team contention
Platform engineering is now mainstream: Gartner named it a top strategic technology trend for 2024 and 2025. Per Gartner's Top Strategic Technology Trends 2024, "by 2026, 80% of large software engineering organizations will establish platform engineering teams as internal providers of reusable services, components and tools for application delivery, up from 45% in 2022." Puppet's State of DevOps / State of Platform Engineering reports (the 2023 edition surveyed 438 people; the 2024 edition surveyed 474) find most platform teams are centralised, serving many business units rather than embedded in one. That centralisation is precisely what turns a platform team into a bottleneck when two major programs both depend on it: DORA's own writing warns that a single team many others rely on becomes "a single point of failure" that must "scale to meet the demands of the many dependent teams." Puppet also consistently flags burnout as a top challenge when teams are pulled in too many directions. Trustworthiness: the trend data is solid; the specific bottleneck dynamic is well-described qualitatively but I did not find published ticket-queue benchmarks quantifying the two-programs-one-platform collision.
7. Portfolio management and WIP limits
The "stop starting, start finishing" principle follows directly from Little's Law and from Reinertsen's queueing work: reduce the number of things in progress and everything finishes sooner. The multi-project academic literature (Engwall and Jerbrant; Zika-Viktorsson) provides the empirical backing that concurrency past a threshold degrades both efficiency and the people doing the work.
Bent Flyvbjerg's How Big Things Get Done (2023) is the most useful recent synthesis, and it refines the thesis rather than simply endorsing sequencing. His doctrine is "think slow, act fast": plan exhaustively, then deliver quickly, because the delivery window is when catastrophic risk accumulates ("by acting fast, you can reduce your risks enormously, especially if you have been thinking slow"). His preferred mechanism is modularity: "big things made from small things," where repetition of a small, standardised block ("build with Lego") drives down cost and time. His best-performing project types (solar, wind) are modular and repeatable; his worst (nuclear, big IT, Olympics) are bespoke and monolithic. The lesson for the parallel-versus-sequential question is that the real enemy is the big, tightly coupled, one-shot effort, whether you run one or two of them. Decompose into independently deliverable modules and the coordination tax falls.
8. Named case examples
TSB (2018). The cleanest documented example of concurrent technical bets colliding. TSB migrated around five million customers and eight million-plus records onto a brand-new platform while simultaneously replacing essentially every technology system and piece of hardware, so it introduced two unproven architectures at once. The migration failed immediately; all branches and a large share of 5.2 million customers were affected, and it took until December 2018 to return to business as usual. The FCA and PRA fined TSB £48.65 million in December 2022 for operational-risk and governance failures including outsourcing management; TSB paid £32.7 million in customer redress; total quantifiable cost exceeded £300 million. The former CIO, Carlos Abarca, was personally fined £81,620 in 2023. Sources: FCA and Bank of England press releases (primary). Trustworthiness: high.
NHS National Programme for IT (NPfIT). Launched 2002, dismantled from 2011. The National Audit Office put spending at about £9.8 billion; some estimates reached £12 billion. Causes documented by the NAO and Public Accounts Committee include top-down imposition on local trusts, gross underestimation of scale, rigid contracts that could not adapt (Fujitsu exited after scope and cost disputes), scope creep, and insufficient clinician engagement. Trustworthiness: high; government audit sources.
These are big-bang and portfolio-overload failures rather than pure two-program collisions, but they illustrate the same mechanism: too much tightly coupled change attempted at once, with shared dependencies and change management that could not keep up. For the user's healthtech context, both TSB (regulated, high-availability, real customer harm) and NPfIT (health system, national scale, stakeholder resistance) are directly analogous.
9. Counter-evidence and nuance
The user values intellectual honesty, so this section matters.
The "70% of transformations fail" statistic is folklore. Mark Hughes (Brighton Business School), in the Journal of Change Management (2011), traced the five most-cited sources for the claim and found none had valid empirical evidence; each either asserted it without data or cited another source that did the same ("the absence of valid and reliable empirical evidence to support such a narrative is highlighted"). The number originates with Hammer and Champy's Reengineering the Corporation (1993), who explicitly called it an "unscientific estimate" of 50% to 70%, applied only to reengineering; Hammer disowned it in 1995, saying there is "no inherent success or failure rate for reengineering." Beer and Nohria's HBR article (2000) stated "about 70% of all change initiatives fail" with no footnote. McKinsey has repeated the 70% figure without a primary source, at one point circularly footnoting it back to Kotter. McKinsey's own measured digital-transformation data is a different and more defensible number: its 2018 Global Survey ("Unlocking success in digital transformations," October 2018, n=1,793, fielded January 16-26, 2018) found that "only 16 percent of respondents say their organizations' digital transformations have successfully improved performance and also equipped them to sustain changes in the long term." Bottom line: do not use "70% fail." Trustworthiness of the debunking: high.
The Standish CHAOS reports are widely cited and methodologically criticised. Eveleens and Verhoef, "The Rise and Fall of the Chaos Report Figures," IEEE Software (2010), show the definitions are based solely on estimation accuracy of cost, time and functionality, are one-sided, and produce misleading success rates; the underlying method is not fully disclosed. Magne Jorgensen and Robert Glass have made similar critiques. Standish's headline figures (roughly a third of projects "succeed," about a fifth "fail," and the rest are "challenged") have barely moved in 30 years, which itself suggests they measure a definition rather than reality. Trustworthiness of CHAOS as data: low. Use the McKinsey-Oxford and Flyvbjerg numbers instead.
The "85% of data/AI projects fail" family of stats is analyst prediction, not measurement, as covered above. Treat as sentiment.
The case for some parallelism is real. The strongest version: in a cloud migration, doing data-platform modernisation during the move (rather than lift-and-shift then modernise later) can avoid doing the work twice. Rackspace argues separating migration and modernisation "often recreates legacy constraints in a new environment" and turns the "migration complete" milestone into "the start of a second, unplanned transformation." McKinsey argues most cloud value comes from modernisation and recommends aligning migration with application upgrades. Thoughtworks argues scoping and migrating together cuts the cost and risk of large-scale modernisation. Caveat: this evidence is consultant- and vendor-sourced, not controlled trials, and a balanced view (for example CleanSlate) notes there is "no universal sequence" and that forcing full modernisation before any migration also increases risk by turning it into one high-stakes event.
Sequencing has its own costs. Reinertsen's cost-of-delay work shows organisations systematically underestimate the economic cost of delaying valuable work, which is an argument against needlessly deferring a second initiative. But note this cuts both ways: cost-of-delay tools like Weighted Shortest Job First are fundamentally about smart prioritised sequencing under limited capacity, not blanket parallelism. The folk claim that "the second initiative never starts" if you sequence is plausible but I found no citable study for it; present it as practitioner wisdom, not evidence.
10. Useful mental models and vocabulary
- Coordination tax / coordination overhead: general term; best formalised by Brooks's communication paths and the USL coherency term.
- Coherency penalty / crosstalk: Neil Gunther, Universal Scalability Law (1993). The β term that makes throughput fall past an optimum.
- Contention: Gunther's α term; queueing for shared resources.
- N-squared communication problem: Fred Brooks, The Mythical Man-Month (1975); n(n-1)/2.
- Resource allocation syndrome: Engwall and Jerbrant (2003); the prime challenge of multi-project management.
- Project overload: Zika-Viktorsson, Sundstrom and Engwall (2006).
- Critical chain and multi-project critical chain: Eliyahu Goldratt, Critical Chain (1997); resource contention across projects.
- Portfolio WIP / "stop starting, start finishing": Kanban community; grounded in Little's Law and Reinertsen.
- Cost of delay / Weighted Shortest Job First: Reinertsen, The Principles of Product Development Flow (2009).
- Cognitive load / interaction modes: Skelton and Pais, Team Topologies (2019).
- Think slow, act fast / modularity / build with Lego: Flyvbjerg and Gardner, How Big Things Get Done (2023).
- Change collision / change freeze windows: ITIL change-management vocabulary.
- Loosely coupled architecture and teams: DORA / Accelerate.
The strongest facts to anchor a post
- Kingman's utilisation math: pushing a shared team from 80% to 90% loaded roughly doubles the queue, and 90% to 95% doubles it again. Concrete, mathematically true, and instantly intuitive for why a shared platform team becomes a bottleneck.
- The Universal Scalability Law's coherency term: past a point, adding concurrency makes total throughput fall, not plateau. This is the precise mechanism behind "compounding coordination tax" and it has a real equation behind it.
- DORA/Accelerate: external approvals slow delivery with no improvement in change-failure rate, and loosely coupled teams are among the strongest predictors of delivery performance. High-quality, large-sample evidence that coordination machinery is a tax, not a safeguard.
- TSB (2018): two unproven architectures cut over at once, all branches affected, £48.65m regulator fine, over £300m total cost, personal fine for the CIO. A concrete, fully documented cautionary tale.
The weakest or most contestable claims to avoid or caveat
- "70% of transformations fail." Folklore; traced to an unscientific 1993 estimate that its own author disowned. Do not use.
- Standish CHAOS success/failure percentages. Methodologically discredited (Eveleens and Verhoef, 2010). Do not use as hard data.
- "85% (or 80%) of big-data/AI projects fail." Analyst predictions that drift between 60% and 95%; not measured outcomes. Even RAND's 2024 figure is flagged as "some estimates," not a measurement.
- Weinberg's "75% lost to switching at five projects." A useful illustration but a heuristic, not data, and its own community disputes the linearity.
- Gloria Mark's "23 minutes 15 seconds." Real researcher, real body of work, but this specific number is misattributed to a paper that does not contain it and measures return-to-task, not regained focus.
- The specific "38% of migrations over budget / 23% average overrun" and "80% of enterprises report cloud cost overrun" numbers circulate on aggregator sites and I could not confirm them against primary IDC or McKinsey documents.
Recommendations
- Frame the post around mechanism, not received wisdom. Lead with Kingman and the USL coherency term, because they are true, precise, and rarely cited in LinkedIn writing, and they explain why the tax compounds rather than adds.
- Anchor the empirical weight on McKinsey-Oxford (5,400 projects) and DORA, and explicitly retire the Standish and "70%" numbers. This signals intellectual honesty, which the audience values. Benchmark that would change this: if Standish ever published its full method and raw data, or a peer-reviewed replication appeared, it could be reconsidered.
- Use TSB as the concrete story and NPfIT as the scale example; both are health-adjacent or health-sector, which suits the user's audience.
- State the refined takeaway: the highest-leverage decision is what not to run concurrently, but the deeper principle is to decompose into small, loosely coupled, independently deliverable modules and cap portfolio WIP. That reframes "sequence vs parallel" as "reduce coupling and WIP," which is both more defensible and more actionable.
- Concede the counter-case honestly: doing data-platform modernisation during a cloud migration can be the right call when it avoids doing the work twice; the test is whether the two efforts are tightly coupled (then the coordination tax dominates) or genuinely separable (then parallel can win). The decision rule: score each pair of initiatives on shared teams, shared infrastructure dependencies, and overlapping change windows; if they share two or three of those, sequence or interleave; if they share none, parallel is safe.
Caveats
- Several of the theoretical models (USL applied to organisations, Brooks's Law, Team Topologies cognitive load) are analogies or qualitative frameworks, not measured organisational effect sizes. They explain the mechanism convincingly but should not be presented as if someone measured the exact coordination tax of a specific two-program collision.
- The single biggest evidence gap is direct, quantified data linking concurrent-program change collision to incident rates. ITIL asserts it; DORA's approval and batch-size findings are the strongest proxy; no clean controlled study surfaced.
- Much of the cloud "parallel avoids double work" case comes from consultancies and vendors with a commercial interest in modernisation services. It is a well-argued position, not a proven statistic.
- Consulting self-surveys on transformation success rates (McKinsey, BCG, Bain) carry obvious incentive bias and their reported success rates range wildly (roughly 12% to 88%), which is itself evidence that "X% fail" headlines are definition-dependent.
- My web research budget was capped mid-way, so a few targeted items (Little's Law flow-metric case data from Vacanti/Magennis, SAFe program-increment dependency data, and additional healthtech-specific collision post-mortems) are covered by theory and adjacent sources rather than a dedicated primary pull. Treat those as directionally supported rather than exhaustively sourced.
- mckinsey + 3 — https://www.mckinsey.com/capabilities/tech-and-ai/our-insights/delivering-large-scale-it-projects-on-time-on-budget-and-on-value
Commissioned from our research desk. Subject to final editorial discretion.