The proof is indisputable.
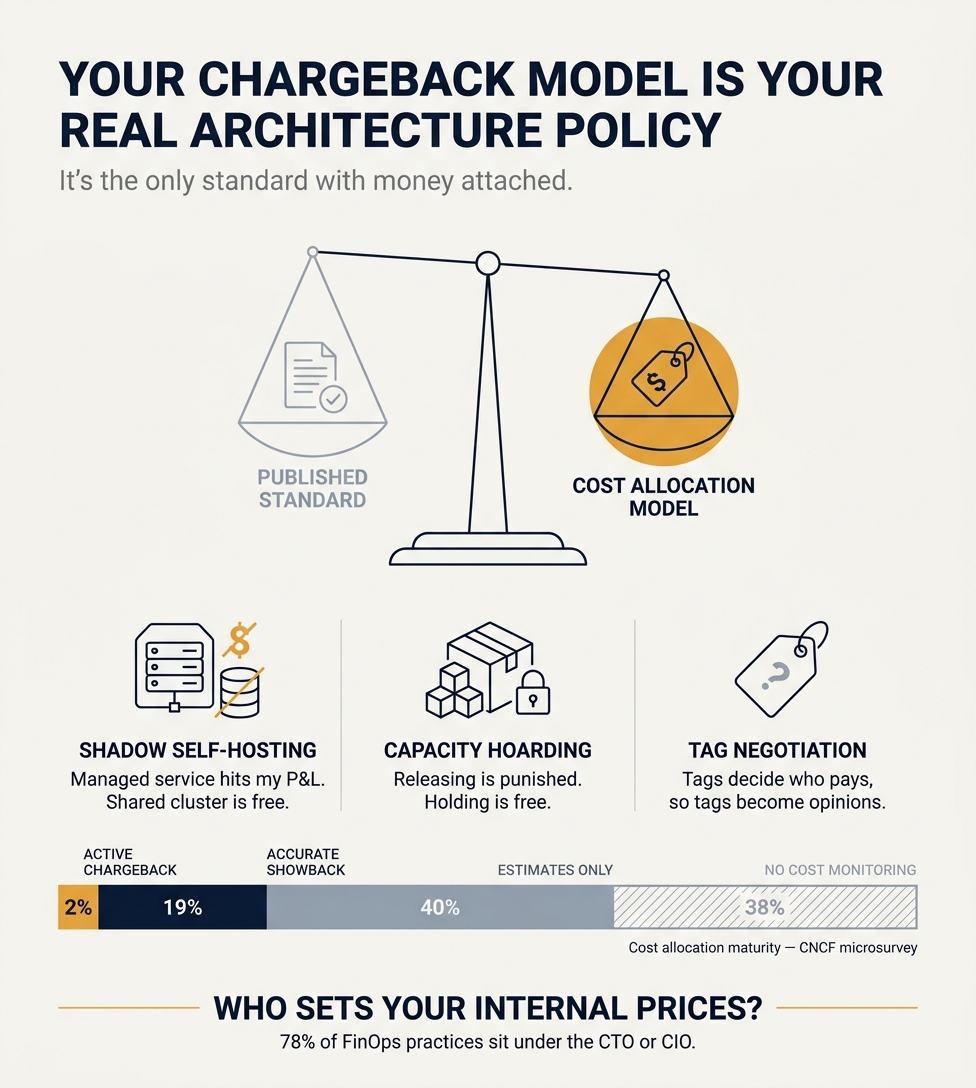
A few years ago I watched a team quietly stand up their own Postgres on our shared Kubernetes cluster, three months after we published a standard saying use the managed database service. I expected a philosophical objection to managed services, or a scar from some old outage. What I found was arithmetic. The managed database showed up as a line item on their budget. The cluster capacity did not show up anywhere at all. They were not defying our architecture standard so much as responding to a much louder one nobody had written down.
The document that actually governs your architecture is your cost allocation model. It is the only architecture policy with money attached, and money is read more carefully than principles.
The distortions are boringly predictable once you look for them. If a managed service lands on a team's P&L and shared compute is absorbed centrally, work migrates onto the shared cluster, even when total company cost rises once you count operational time. If budgets are annual and unused capacity gets clawed back, teams hoard reservations and keep idle environments alive, because releasing capacity is punished and holding it is free. If tags determine who pays, tagging becomes a negotiation rather than a fact.
The sharpest version is shared infrastructure nobody owns. A CNCF microsurvey found 2% of teams ran active chargeback, 19% had accurate showback, 40% worked from estimates, and 38% had no cost monitoring at all. Datadog's work suggests roughly 83% of container spend sits on idle resources. Routing traffic to object storage through a NAT gateway instead of a free VPC endpoint is an architecture decision with a per gigabyte bill that lands on nobody's desk, which is why it survives for years. If you cannot attribute most of your spend to an owner, your standards are being overruled daily by a signal you never designed.
The fix is not to rush into chargeback. Ross, Vitale and Beath found chargeback meaningfully influenced IT investment decisions in only 4 of 10 firms, and badly designed chargeback mostly generated resentment toward the central team. Showback with credible allocation and one or two honest unit metrics, cost per customer or cost per transaction, changes more decisions than an internal billing system that needs an accountant to read.
So go find out who decides how shared costs get split, which services get charged back, and what your internal platform charges per unit. In the 2026 State of FinOps data, 78% of these practices sit inside the CTO or CIO organisation, so the person exists near you.
Then ask whether anyone from architecture was in the room when those prices were set. That person is writing your real architecture policy, and they probably do not know it.
Your cloud chargeback model is a stronger architecture policy than anything the architecture team publishes: a research brief
TL;DR
- The claim holds up well. Cost allocation models (showback, chargeback, central absorption) act as de facto architecture governance because they attach money and accountability to engineering choices, which shapes behaviour more reliably than principles docs or review boards. The economics literature (Coase, Williamson, Eccles) and the IT chargeback research (Nolan, Olson and Ives, Ross et al.) all support this, and modern FinOps survey data shows the same pattern at cloud scale.
- The distortions are predictable and documented. Teams avoid managed services when the cost lands on their own line, self-host on shared clusters where cost is diffused, hoard committed capacity under "use it or lose it" budgets, and game tags. Shared and untagged infrastructure (Kubernetes, NAT gateways, egress, observability) is the accountability void nobody optimises. Estimated cloud waste is 29 percent (Flexera 2026), and a large share of spend cannot be cleanly attributed to an owner.
- The honest nuance: chargeback only changes behaviour in a minority of naive implementations, showback is often the stable steady state, and the real prize is unit economics (what a unit of value costs), not internal billing purity. The unresolved question is who owns the internal pricing model, because whoever sets the prices is quietly setting the architecture incentives, and architecture teams are rarely in that room.
Key findings
- The core argument is well grounded in both economics and decades of IT chargeback research. Chargeback is now studied explicitly as an IT governance mechanism, not just an accounting exercise.
- Cost visibility alone moves behaviour weakly; financial accountability moves it more strongly but unevenly. In the keystone academic study, only 4 of 10 firms said chargeback significantly influenced IT investment decisions.
- Cloud waste sits at 27 to 32 percent of spend and has barely moved since 2019. The Flexera 2026 report shows it rising to 29 percent, reversing a five-year downward trend, driven by AI and new services.
- Kubernetes is the sharpest modern example of the allocation void. The CNCF Cloud Native and Kubernetes FinOps Microsurvey (fieldwork June to November 2023, published December 2023, roughly 100 responses) found 2 percent run active chargeback, 19 percent run accurate showback, 40 percent rely on estimates, and 38 percent have no monitoring in place at all. Datadog found 83 percent of container spend is on idle resources.
- Full cost allocation is now the number two FinOps priority, but comprehensive allocation targets (80 percent of spend allocated at "Walk", 90 percent at "Run") are still aspirational for most.
- FinOps overwhelmingly reports into technology leadership, not finance. In the State of FinOps 2026 data, 78 percent of practices report into the CTO/CIO organisation (up 18 percent versus 2023) and only 8 percent into the CFO. This is where the architecture incentive is being set.
Details
1. The core argument: allocation as de facto governance
The intellectual chain is clean and citable.
- Ronald Coase, "The Nature of the Firm" (1937, Economica): the firm exists because using the price mechanism is costly. The moment you impose an internal price (chargeback) on something previously coordinated by hierarchy, you reintroduce transaction costs (price discovery, negotiation, measurement) inside the firm. Coase won the 1991 Nobel Memorial Prize for this line of work.
- Oliver Williamson (Markets and Hierarchies, 1975; The Economic Institutions of Capitalism, 1985): the make-or-buy choice turns on asset specificity, uncertainty and frequency, plus bounded rationality and opportunism. Markets provide stronger (higher-powered) incentives; hierarchies offer better control but suffer "incentive limits and bureaucratic distortions". Chargeback is an attempt to inject market-like incentives into a hierarchy, and Williamson's framework predicts it generates measurement cost and distorted incentives.
- Robert Eccles, The Transfer Pricing Problem (1985) and "Control with Fairness in Transfer Pricing" (Harvard Business Review, 1983): transfer pricing is an administrative and fairness problem, not just an optimisation one. A transfer price simultaneously serves incompatible purposes (economic decisions, performance measurement, motivation), so it creates competing demands. Divisions with autonomy will under-consume internal services (buy or build outside) or over-consume when prices do not reflect true marginal cost.
- Ross, Vitale and Beath, "The Untapped Potential of IT Chargeback" (MIS Quarterly, 1999): the keystone paper. It imports Eccles' transfer-pricing model directly into IT and states that "Eccles' model of transfer pricing provides a theoretical framework for this claim, and it also explains why chargeback systems can raise issues of fairness or create conflict between IT and its clients". It builds on Nolan (1977, Communications of the ACM) and Olson and Ives (1982, MIS Quarterly), which found chargeback exacerbates tensions between the IT unit and its clients. Modern IS scholarship (Hsieh et al.) treats IT chargeback explicitly as "an IT governance mechanism", which is the direct academic support for the "chargeback as architecture policy" thesis. [1][2]
The Conway's Law analogue is well established in practitioner writing. Conway's 1967 observation is that "organizations which design systems are constrained to produce designs which are copies of the communication structures of these organizations". Multiple practitioner sources extend this to incentives and budgets: "If budgets, KPIs, or governance are siloed, communication will be too, reinforcing the mirrored architecture" (Umbrex). The financial-structure version of Conway's Law ("the budget shapes the system", "you get the architecture your incentive system pays for") is a practitioner framing rather than a formally named law, and should be flagged as such. [3]
2. Predictable distortions
Avoiding managed services and self-hosting on shared compute. The structural driver is stated plainly in the FinOps community: "the person allocating resources is not the person paying the bill" (FinOps Weekly). When a managed service (RDS, MSK, Snowflake, Datadog) lands visibly on a team's own budget line but shared cluster compute is diffused or absorbed centrally, teams rationally push work onto the shared cluster. This is Goodhart's law in action (see below): work migrates to the untracked category. Note the honest counterpoint that self-hosting is usually a false economy once operations are included: operations can represent 51 percent of total cost of ownership (Strapi), and IT teams spend on average 34 working days per year resolving Kubernetes issues (DistantJob citing industry data). So the allocation model can push teams toward a choice that is worse for the company overall but cheaper on their own line. [4]
Capacity hoarding and "use it or lose it". Reserved Instances and reservations are explicitly "use it or lose it": "if you don't use your reserved instances one month you don't get extra time the next month" (ParkMyCloud). Under annually allocated budgets where unused budget gets clawed back, teams over-provision, keep idle environments and refuse to release capacity. Datadog's State of Cloud Costs 2024 quantifies the result: "our research shows that 83 percent of container costs are associated with idle resources. About 54 percent of this wasted spend is on cluster idle [over-provisioned infrastructure]. The remaining 29 percent is associated with workload idle [requests larger than needed]." [5]
Tag gaming and mis-tagging. Tagging is the load-bearing foundation of allocation, and it is weak. Crawl-stage orgs sit around 40 to 60 percent tag coverage (Cloudaware). Teams tag to shared or unowned cost centres, avoid tagging, or exploit policy. The reverse failure also happens: strict enforcement can drive resource sprawl or shadow accounts. The FinOps Foundation notes that achieving a 0 percent untagged rate is difficult because some service types are inherently "untaggable".
Showback vs chargeback vs central absorption. Showback moves information; chargeback moves money; central absorption hides both. Under central absorption nobody optimises. Under showback, behaviour changes modestly (some sources claim 15 to 20 percent waste reduction from visibility alone, which should be treated as vendor-sourced and directional). Under chargeback, accountability is strongest but so are the perverse incentives (gaming, resentment, avoidance of central services). Fixed-rate chargeback removes the incentive to right-size ("if you pay the same whether you run 10 instances or 20, there is no financial incentive to right-size", Holori). Adoption data: per FinOps Foundation research cited by Opslyft, around 57 percent of mature FinOps organisations use showback as the primary model, roughly 18 percent run pure chargeback and about 25 percent a hybrid. Treat these specific splits as secondary-sourced.
Cross-charging friction and duplicated infrastructure. When the internal price of a platform service is unattractive or unpredictable, teams build their own. This is the direct modern echo of the classic chargeback-drives-shadow-IT finding. NetSuite frames the accounting distortion well: chargebacks "almost always make small products look unprofitable", and removing disincentives to use central services is the key design goal. [6]
Internal platform pricing. The "platform as a product" literature is explicit that adoption is the north star and that forced adoption or unattractive pricing pushes teams to "route around it with shadow IT" (Jellyfish). Free at point of use maximises adoption but removes the cost signal; fully loaded pricing restores the signal but risks avoidance. This is the core tension the reader should sit with. [7]
3. The shared and untagged accountability void
Why shared costs are hardest to allocate. Kubernetes clusters, NAT gateways, data transfer, load balancers, observability, CI/CD, shared databases, support plans and egress are all consumed jointly, so nobody owns the optimisation. "Pretending shared costs don't exist, or holding them all centrally, skews the chargeback picture. Teams that heavily use shared platforms look artificially cheap" (CloudZero). [8]
How much is unallocated. The FinOps allocation capability defines comprehensive allocation as at least 80 percent of spend allocated at "Walk" maturity and 90 percent at "Run", with a target of keeping unallocated costs below 10 percent. CloudZero's State of Cloud Cost research found only about 30 percent of organisations can accurately identify where their cloud budget is going, and in its 2024 State of Cloud Cost survey, 42 percent of respondents could only give an estimate of how spend maps to customers/products/features and over 20 percent had little to no idea; two-thirds of companies could not accurately measure unit costs. Datadog (2024) is cited for the claim that 61 percent of engineering teams cannot attribute more than 80 percent of cloud costs to a specific team, service or product.
Allocation methods for shared costs and their distortions. Even split (simple but penalises light users and lets heavy users hide), proportional/pro-rata by usage (fairer but needs good telemetry), fixed ratio (predictable but arbitrary), and ignore/absorb centrally (zero friction, zero accountability). FOCUS (the FinOps Open Cost and Usage Specification) is the emerging standard: it carries BilledCost and EffectiveCost on a single row, amortises prepaid commitments over their term, and version 1.3 (ratified by the FOCUS Steering Committee on 5 December 2025) added split cost allocation columns that let data generators expose how they split costs across workloads, with 11 providers now exporting FOCUS data including AWS, Azure, GCP, Oracle and Alibaba. 57 percent of FinOps practitioners planned to adopt FOCUS within 12 months per the 2025 State of FinOps report. [9][9]
Data transfer and egress as an under-owned category. This is the clearest case of architecture decisions with invisible cost consequences. AWS charges roughly 0.09 USD per GB for the first 10 TB of internet egress, 0.045 USD per GB for NAT gateway processing, and 0.01 USD per GB each way for cross-AZ traffic; inbound is free. Data transfer frequently accounts for 10 to 20 percent of total AWS spend at mid-to-large scale (Usage.ai). The classic trap: routing S3/DynamoDB traffic through a NAT gateway costs 0.045 USD per GB that is completely avoidable with a free VPC gateway endpoint, and a NAT gateway in a different AZ from its instances stacks cross-AZ charges on top. These are pure architecture choices whose cost is nearly always unowned.
4. FinOps Foundation specific data
- Priorities. Workload optimisation and waste reduction is the number one priority (50 percent of practitioners in 2025). Full allocation of cloud spending is the number two priority (30 percent ranking it top in 2025). Accurate forecasting is third. In 2023, "empowering engineers to take action" was displaced as the top priority for the first time by waste reduction and commitment management. Managing commitment-based discounts jumped to 43 percent in 2024 from just 7 percent previously.
- Chargeback vs showback maturity. The FinOps Framework states that automated finance integration for chargeback is characteristic of "Run" maturity, and that where strategy is lacking, "shared costs and discounts are held centrally due to lack of strategy on how to provide visibility and/or allocation".
- Allocation maturity model (Crawl, Walk, Run). At least 80 percent of spend allocated at Walk, 90 percent at Run; metadata compliance target 80 percent; unallocated below 10 percent. Fewer than 15 percent of organisations are estimated to be at the "Run" stage (secondary source, Opsio citing the FinOps Foundation).
- Unit economics adoption. Unit economics is treated as the most advanced layer and remains rare. CloudZero found two-thirds of companies cannot accurately measure unit costs. The FinOps 2026 data highlights "pre-deployment architecture costing" as a top requested tooling capability, which is a shift-left of cost into architecture decisions.
- Team placement. The 6th Annual State of FinOps 2026 (published February 2026, N of roughly 1,192, representing more than 83 billion USD in annual cloud spend) found 78 percent of practices report into the CTO/CIO organisation (up 18 percent versus 2023); 8 percent report to the CFO; 60 percent use centralised enablement, 21 percent hub-and-spoke. Those with VP/C-suite engagement show 2 to 4x more influence over technology selection (cloud service selection 53 percent vs 12 percent for director-level-only practices).
5. Supporting industry data
- Flexera 2026 State of the Cloud (753 respondents, surveyed winter 2025, released 18 March 2026): estimated wasted cloud spend rose to 29 percent, reversing a five-year downward trend, attributed to AI and new IaaS/PaaS services. 85 percent cite managing cloud spend as a top challenge; 63 percent have established FinOps teams; 71 percent run a Cloud Centre of Excellence. Flexera 2025 (759 respondents): 27 percent waste, 84 percent struggle to manage spend, organisations exceed budgets by 17 percent and expect 28 percent spend growth.
- Cloud waste consensus: 27 to 32 percent every year since 2019 across Flexera, Harness and Datadog. Against Gartner's forecast of 723.4 billion USD in worldwide end-user public cloud spending for 2025 (Gartner, 19 November 2024 forecast, up from 595.7 billion USD in 2024), 27 percent implies roughly 195 billion USD wasted.
- CNCF FinOps for Kubernetes microsurvey (fieldwork June to November 2023, published December 2023, roughly 100 responses): 49 percent saw cloud spend increase after adopting Kubernetes, 70 percent of those citing over-provisioning; 2 percent run active chargeback, 19 percent run accurate showback, 40 percent rely on estimates, 38 percent have no monitoring in place; 45 percent cite an accountability gap as a driver of overruns.
- Datadog State of Cloud Costs 2024: 83 percent of container costs are idle (54 percent cluster idle, 29 percent workload idle); GPU instance spend up 40 percent year over year.
- AWS built Split Cost Allocation Data for EKS specifically because customers could not allocate shared EC2 costs across Kubernetes teams.
6. Academic and theoretical grounding
See the chain in section 1. The additional empirical points:
- Bergeron (1986, MIS Quarterly): chargeback information only changes manager behaviour when paired with budget accountability and cost variability. Flat allocations do not change consumption; usage-variable charges tied to accountability do.
- Ross, Vitale and Beath (1999): only 4 of 10 firms said chargeback significantly influenced IT investment decisions, and poorly designed chargeback "often generated resentment toward the IT unit because business unit managers felt that while they were struggling to reduce costs, the IT unit was transferring unnecessary and unmanaged costs to them". [10]
- Goodhart's law (Charles Goodhart, 1975): "Any observed statistical regularity will tend to collapse once pressure is placed upon it for control purposes." Popularised by Marilyn Strathern (1997) as "when a measure becomes a target, it ceases to be a good measure." Applied here: once cost-per-team or cost-per-VM becomes the target, teams optimise the metric (shift to untracked categories, game tags) rather than true efficiency. [11][12]
- Campbell's law (Donald Campbell, 1976): "The more any quantitative social indicator is used for social decision-making, the more subject it will be to corruption pressures and the more apt it will be to distort and corrupt the social processes it is intended to monitor." A cost metric used for allocation is exactly such an indicator. [13]
7. Counterarguments and nuance
- Chargeback can work well when designed with fairness, communication and usage-based variable charges (Ross et al.; Bergeron). Vendor-reported cases claim material behaviour change (for example, Upstart used cost per product and cost per organisation to drive engineering accountability and reduce costs by 20 million USD; Drift reduced annual cloud costs by 2.4 million USD via cost per customer). Treat vendor case studies as directional.
- Showback is often sufficient and is the stable steady state for most, not a beginner phase you outgrow. The FinOps Foundation is explicit that the choice between showback and chargeback "depends on your organization's accounting policies, not a maturity checklist".
- The accounting model is downstream of a real business question. The strongest framing is that unit economics (what does a unit of value cost us?) is the right frame, and internal billing is a means, not the end. Aggregate spend is a lagging indicator; unit cost is the leading indicator that connects infrastructure to business outcomes.
- Cost visibility alone changes behaviour only weakly and conditionally; accountability, budget ownership and variable charges are what move the needle.
- Over-optimising for allocation purity risks engineering velocity. A chargeback model "that requires a PhD in cloud accounting" drives confusion, not behaviour change (CloudZero). The 80/20 approach (allocate major categories cleanly, acknowledge shared-cost approximations, iterate) is the recommended posture. [8]
8. The concluding question: who owns the internal pricing model
Whoever owns the internal price is setting architecture incentives, often without the architecture team in the room. The data shows FinOps sits in technology (78 percent CTO/CIO, 8 percent CFO in the State of FinOps 2026 data), usually as a small central enablement team (60 percent). The FinOps Foundation deliberately does not prescribe a reporting line and treats FinOps as cross-functional. Finance owns the accounting policy that decides chargeback vs showback and how shared costs and discounts are handled. Platform engineering is increasingly a named partner, and the 2026 data shows FinOps teams "engaging with Platform Engineering and Enterprise Architecture teams, building pricing calculators". But there is no evidence that architecture teams typically own or co-design the cost model, even though it functions as their most powerful policy. That gap is the point the reader should be left with.
Recommendations
- Audit your allocation regime first, before touching principles docs. Establish what percentage of spend you can attribute to an owner today. If it is below 80 percent you are in "Crawl/Walk" territory and your published architecture standards are being overridden by invisible cost signals. Benchmark against the FinOps targets (80 percent allocated at Walk, 90 percent at Run, unallocated below 10 percent).
- Map the untracked escape hatches. Identify where cost is diffused (shared clusters, central absorption) versus where it lands visibly (managed services, per-team budgets). Any asymmetry is an architecture incentive. If shared cluster compute is free-to-the-team but RDS is charged, expect self-hosting. Fix the asymmetry before you write a standard telling people to use managed services.
- Treat data transfer and egress as a first-class owned cost. NAT gateway routing, cross-AZ chatter and egress are pure architecture decisions with invisible bills. Put VPC gateway endpoints in the paved path and make cross-AZ traffic visible per team.
- Prefer showback plus unit economics over rushing to chargeback. Showback with credible allocation and one or two real unit-cost metrics (cost per customer, per tenant, per transaction) will change more decisions than a punitive chargeback that breeds resentment and gaming. Only move to chargeback for well-tagged teams above roughly 90 percent allocation accuracy.
- Design against Goodhart and Campbell. Pair any cost target with a counter-metric (for example, cost per unit of value alongside absolute spend) so gaming one exposes distortion in the other. Run any new chargeback in shadow mode for one to two billing cycles before it moves money.
- Put architecture in the room where the price is set. Since the cost model is functioning as architecture policy, the architecture team should co-own or at least co-design the internal pricing model with FinOps, finance and platform engineering. Pre-deployment architecture costing (shift-left) is the concrete mechanism.
Thresholds that change the plan: if allocation accuracy is under 80 percent, stay on showback and fix tagging. If it is above 90 percent and finance systems are integrated, chargeback for those teams becomes viable. If waste is above the roughly 27 to 29 percent benchmark, the problem is incentives and idle capacity, not standards.
Caveats
- Waste percentages (27 to 32 percent) are self-reported estimates, not audited figures, and the definition of "waste" varies by source.
- Several specific splits (57/18/25 showback/chargeback/hybrid; 15 to 20 percent waste reduction from showback; fewer than 15 percent at "Run") come from vendor blogs citing the FinOps Foundation rather than from the primary report, and should be attributed cautiously.
- Vendor case studies (CloudZero, Datadog and others) are promotional and directional, not peer-reviewed.
- The financial-structure version of Conway's Law is a practitioner framing, not a formally established law.
- The academic chargeback literature is strong on the mechanism (chargeback breeds conflict and avoidance of central IT) but the explicit "chargeback causes shadow IT" causal claim is made most forcefully in vendor and analyst material.
- Some FinOps priority percentages shift year to year and across report editions; the report year is noted throughout so the user can attribute correctly. The CNCF microsurvey has a small sample (roughly 100 responses) and should be read as indicative rather than definitive.
- MIS Quarterly — https://misq.umn.edu/the-untapped-potential-of-it-chargeback.html
- ACM Digital Library — https://dl.acm.org/doi/abs/10.2307/249752
- Umbrex — https://umbrex.com/resources/frameworks/organization-frameworks/conways-law/
- Finopsweekly + 2 — https://finopsweekly.com/blog/you-moved-to-kubernetes-your-cpu-utilization-is-still-10/
- Medium — https://jaychapel.medium.com/how-do-i-stop-wasting-money-on-reserved-instances-54bef7762836
- NetSuite — https://www.netsuite.com/portal/resource/articles/financial-management/cogs-chargebacks.shtml
- Jellyfish — https://jellyfish.co/library/platform-engineering/
- CloudZero — https://www.cloudzero.com/blog/chargeback-vs-showback/
- Amnic — https://amnic.com/blogs/finops-open-cost-and-usage-specification-guide-2026
- MIT DSpace — https://dspace.mit.edu/bitstream/handle/1721.1/2656/SWP-3956-37617958-CISR-300.pdf?sequence=1&isAllowed=y
- Wikipedia — https://en.wikipedia.org/wiki/Goodhart's_law
- Very Big Brain — https://verybigbrain.com/psychology-thinking/goodharts-law-when-measuring-a-thing-destroys-its-usefulness/
- Wikipedia — https://en.wikipedia.org/wiki/Campbell%27s_law
Commissioned from our research desk. Subject to final editorial discretion.
The argument that your cloud chargeback model is a more powerful architecture policy than anything the architecture team publishes. Cover how showback, chargeback, and shared-cost allocation choices create predictable distortions—teams avoiding managed services that land on their P&L, hoarding capacity, or gaming tagging—and how untagged shared infrastructure becomes an accountability void nobody optimizes. Look into FinOps Foundation data on allocation maturity, typical percentages of unallocatable spend, and unit-economics practices. Reader should leave asking who owns the internal pricing model, because that person is quietly setting architectural incentives.