The bottleneck AI coding assistants moved rather than removed
BY STAVROS · AUGUST 4, 2026
The proof is indisputable.
THE INSIGHT
A team showed me their AI rollout numbers last quarter. Merged pull requests were way up, and everyone was pleased. I asked how long a PR now waits before a human opens it. Nobody had that number. When we got it, the wait had roughly doubled.
Nothing had gotten faster. The work had moved from a place we were measuring to a place we were not.
Writing code was rarely the thing holding us back. Watch where a senior engineer's hours go for a week and you see reading, waiting for a reviewer, waiting for a shared environment, working out who owns the service they are about to change. Typing the implementation was a small slice. Make that slice dramatically faster and the water just arrives at the narrow part of the pipe sooner.
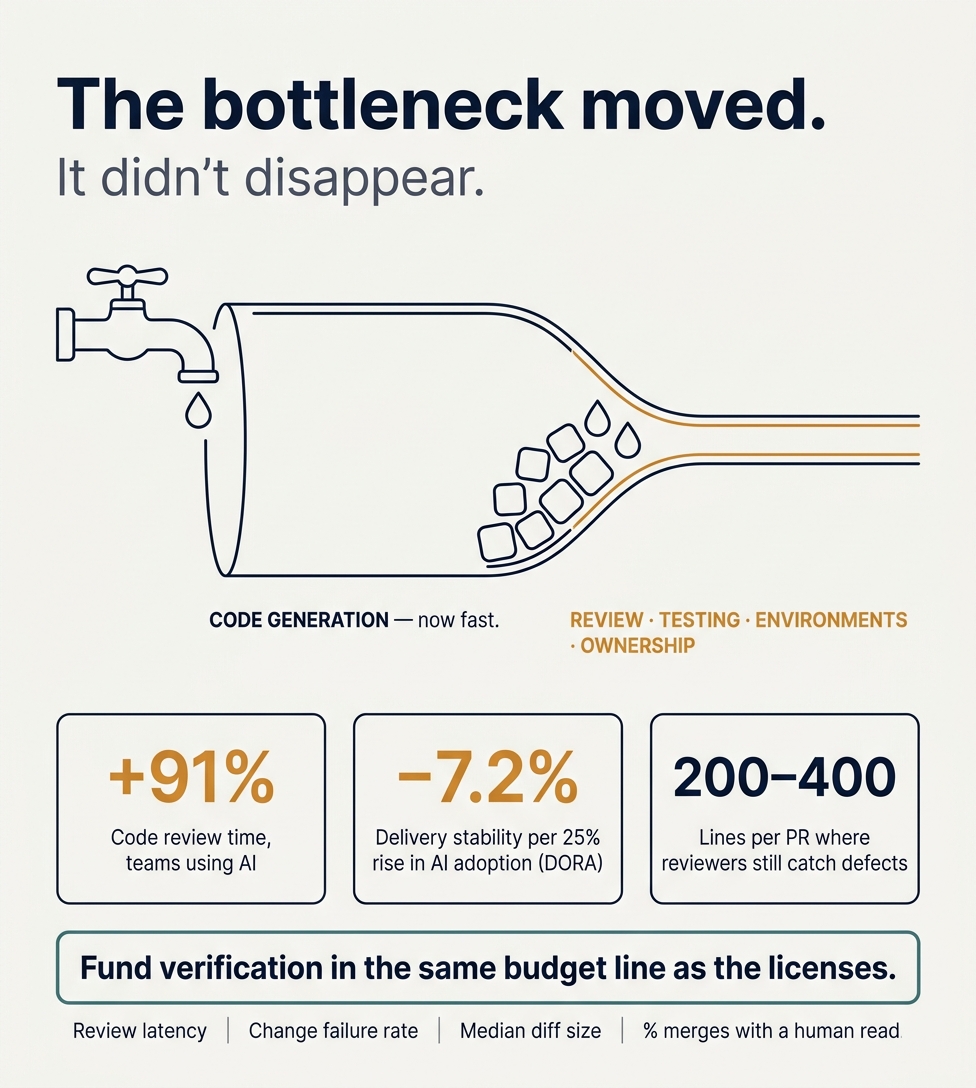
DORA's 2024 report found a 25% increase in AI adoption was associated with a 7.2% decrease in delivery stability. Their 2025 report found throughput positive, stability still negative. Their explanation is the interesting part: acceleration exposes weaknesses downstream. Faros AI's telemetry across a thousand-plus teams says something similar. Developers using AI merged far more PRs, review time rose 91%, and lead time and change failure rate did not budge. Their later update reported review waits climbing further and more PRs merging with no review at all.
That last one is what I would put on the wall. The Cisco study of 2,500 reviews found reviewers catch most defects in changes of 200 to 400 lines, and that attention falls apart after about ninety minutes. That is a fact about human brains, and it did not get an upgrade when the models did. Older automation research shows that when a machine is usually right, people catch about a third of its mistakes, against three quarters when it visibly fails sometimes. So the better these tools get, the less carefully we read what they hand us.
To be fair, generation was a real constraint for some work. A controlled Copilot trial had developers building a small HTTP server 55.8% faster, with the biggest gains for less experienced people. But METR's trial with experienced maintainers in their own large repos found them 19% slower with AI, while they believed they had been 20% faster. Both can be true, and together they tell you where the constraint sits.
DORA also found around 40% of teams manage high throughput and high stability at once, so none of this is fate. Those teams had already built the verification capacity, and the tooling amplified something that was working.
So my ask, as much to myself as anyone: before declaring a productivity win, measure one step downstream. Review latency, change failure rate, median diff size, what fraction of merges got a real human read. And when you write the business case for licenses, put verification work in the same budget line, because a rollout that funds generation and not verification is buying a bigger tap for a pipe you have not touched.
THE EVIDENCE
Research Brief: The Bottleneck AI Coding Assistants Moved Rather Than Removed
A sourced evidence overview for a LinkedIn post arguing that code generation was rarely the binding constraint in software delivery — the constraints were review capacity, test coverage, integration/staging environments, and ownership clarity. Research only; the post is not written here. Facts are grouped so you can pick and choose, with source attribution, sample sizes, and explicit flags where a widely-cited statistic is weakly sourced.
TL;DR
- The weight of primary evidence supports the thesis. AI coding tools reliably increase code volume and individual-perceived productivity, but the gains bottleneck downstream at review, testing, and stability. DORA's 2024 report found that a 25% increase in AI adoption was associated with an estimated 1.5% decrease in delivery throughput and a 7.2% decrease in delivery stability; DORA's more positive 2025 report found throughput turned positive but AI still has a negative relationship with software delivery stability — and DORA's own explanation is that "acceleration exposes weaknesses downstream."
- The strongest single causal datapoint is METR's 2025 RCT: experienced open-source developers were 19% slower with AI despite forecasting a 24% speedup and still believing afterward they were 20% faster — direct support that raw code generation was not the binding constraint for experienced developers in mature codebases.
- The counter-evidence is genuine and must be acknowledged for honesty: a controlled GitHub Copilot trial showed a 55.8% task-completion speedup, and DORA 2025 shows ~40% of teams achieve high throughput and stability simultaneously. The intellectually honest frame is DORA's: AI is an amplifier — it relieves the constraint end-to-end only when review, testing, version control, and platform capabilities scale with generation.
Section 1: DORA / State of DevOps findings on AI adoption
DORA 2024 (Accelerate State of DevOps Report)
- Sample: Over 39,000 professionals worldwide (the AI-specific regression analysis is based on roughly 3,000 respondents).
- Headline AI finding — per 25% increase in AI adoption:
Software delivery throughput: −1.5%
Software delivery stability: −7.2%
Time doing valuable work: −2.6%
Offsetting positives: documentation quality +7.5%, plus positive correlations with code quality, code-review speed, reduced code complexity, and reduced technical debt.
- Software delivery throughput: −1.5%
- Software delivery stability: −7.2%
- Time doing valuable work: −2.6%
- Offsetting positives: documentation quality +7.5%, plus positive correlations with code quality, code-review speed, reduced code complexity, and reduced technical debt.
- DORA's own 2024 interpretation: AI increases individual productivity, flow, and job satisfaction but negatively impacts delivery stability and throughput. DORA attributed this directly to larger batch sizes — AI makes it easier to write more code, and larger changesets carry more risk. DORA reaffirmed that "fundamentals like small batch sizes and robust testing remain crucial." [1]
- Platform engineering caveat (2024): Internal developer platforms improved individual productivity and organizational performance but also "can lead to decreased change stability and throughput," requiring careful implementation.
DORA 2025 (State of AI-assisted Software Development Report)
- Sample (primary source confirmed): Nearly 5,000 technology professionals + more than 100 hours of qualitative data; survey fielded June 13–July 21, 2025; announcement blog dated Sept 23, 2025 (authors Nathen Harvey & Derek DeBellis). The DORA AI Capabilities Model was built from 78 in-depth interviews. [2]
- Adoption: 90% of respondents now use AI at work — a 14.1% increase over the 2024 metric. Median of 2 hours/day interacting with AI (~one-quarter of an 8-hour workday); median 16 months of AI-tool experience. [2][2]
- Trust: 30% report "a little" (23%) or "no trust at all" (7%) in AI-generated code (full distribution: Not at all 7%, A little 23%, Somewhat 46%, A lot 20%, A great deal 4%). The 2025 report calls this "slightly lower than last year." ⚠️ Attribution note: the frequently-quoted 39.2% figure is from the 2024 report and is NOT restated in the 2025 report — attribute it to 2024. [2]
- Methodology change (important): 2025 uses standardized beta weights (the standard-deviation change in an outcome per standard-deviation increase in AI adoption), reported graphically with 89% credible intervals on an x-axis of −0.05 to 0.20. It deliberately does not print per-outcome numeric point estimates in prose — only directions. This is a break from the 2024 "per 25% adoption" percentages, so the two years are not directly comparable in units. [2]
- 2025 directional findings — higher AI adoption is associated with: higher individual effectiveness; higher throughput (REVERSED from negative in 2024); higher product performance (shifted from neutral in 2024); higher team performance; higher code quality; higher organizational performance; higher % of time on valuable work (reversed from negative) — BUT higher software delivery instability (unchanged from 2024 — AI still hurts stability). Friction and burnout: no measurable relationship ("similar levels"). [2]
- The central frame — "AI is an amplifier" (verbatim, executive summary): "AI's primary role in software development is that of an amplifier. It magnifies the strengths of high-performing organizations and the dysfunctions of struggling ones." Blog: "AI doesn't fix a team; it amplifies what's already there." [2][3]
- DORA's own causal theory (2025, verbatim) — essentially the user's thesis, stated by DORA: "AI accelerates software development, but that acceleration can expose weaknesses downstream. Without robust control systems, like strong automated testing, mature version control practices, and fast feedback loops, an increase in change volume leads to instability." [3]
- Seven team profiles (% of sample, from the PDF): Foundational challenges 10%; Legacy bottleneck 11%; Constrained by process 17%; High impact, low cadence 7%; Stable and methodical 15%; Pragmatic performers 20%; Harmonious high-achievers 20%. Clusters 6+7 (~40% of the sample) demonstrate high throughput AND high stability simultaneously — DORA's proof the speed/stability tradeoff is not inevitable. [2][2]
- Seven AI capabilities (the "amplifiers," from 15 candidates tested): (1) clear and communicated AI stance/policy; (2) healthy data ecosystems; (3) AI-accessible internal data; (4) strong version control practices; (5) working in small batches; (6) user-centric focus; (7) quality internal platforms. [2]
- Value Stream Management warning (p.73–74, verbatim): "The greatest risk today isn't falling behind, it's pouring massive investment into chaotic activity that doesn't move the needle." [2]
- DORA caveats to cite: data is self-reported survey data; relationships are correlational, not causal; DORA frames 2025 results as "comparisons" between otherwise-similar respondents, not treatment effects. [2]
Third-party telemetry corroboration
- Faros AI, "AI Engineering Impact Report" (July 2025) — telemetry from 1,255 teams / 10,000+ developers: developers using AI complete 21% more tasks and merge 98% more pull requests, but PR review time increased 91% and AI "has not moved the needle on key delivery metrics like lead time and change failure rate." Faros's 2026 update across 22,000 developers reports the downstream drag worsening: median time in PR review up 441%, 31% more PRs merging with NO review at all, and PR size up 51.3%. This is the clearest independent telemetry that AI moves work downstream rather than removing the constraint. [4][4]
Section 2: Pull request size vs. review quality
The classic SmartBear / Cisco study (2006)
- Largest code-review study of its era: 2,500 reviews, 3.2 million LOC, ~10 months, at Cisco Systems.
- Optimal review size: 200–400 LOC. Beyond 400 LOC, defect-detection ability drops sharply ("the brain can only effectively process so much").
- Defect yield: reviewing 200–400 LOC over 60–90 minutes yields 70–90% defect discovery (find 7–9 of every 10 defects).
- Review speed: inspection rates under 300 LOC/hour give best detection; rates under 500 still acceptable; above 450–500 LOC/hour, defect density is below average in 87% of cases.
- Reviewer fatigue: detection plummets after 60–90 minutes; ~15 defects/hour typical.
- Derived detection-decay figure (widely cited): ~87% defect detection for small PRs (<100 lines) dropping to ~28% for PRs over 1,000 lines. (Note: this specific 87%→28% framing appears in secondary syntheses of the SmartBear data rather than verbatim in the original ebook — cite as "derived from" the Cisco study.)
Modern industry data
- LinearB (8.1M+ PRs across 4,800 teams): PR-size benchmark <100 lines; half of all PRs sit idle for over 50% of their lifespan, one-third idle for ~78%. Elite teams: pickup <7 hours, PRs <219 lines, full cycle <26 hours; lagging teams' PRs can sit a week before anyone looks. An earlier LinearB study (733,000 PRs, 3.9M comments, 26,000 devs) found the same idle pattern. AI-generated PRs face 2.5–5.3× longer review delays and lower merge rates (32.7% vs 84.5%).
- Defect-detection by activity (McConnell, Code Complete): code review catches 55–60% of defects vs unit testing ~25%, function testing ~35%, integration testing ~45% — making review the single highest-yield pre-production gate.
- Turnaround benchmarks: Google average review turnaround ~4 hours (small changes ~1 hour, larger ~5); Microsoft median ~24 hours; industry average outside big tech ~4.4 days for initial review (one study), with developers losing ~5.8 hours/week to review-related bottlenecks.
Section 3: Defect escape rates and cost-to-fix by stage
- The classic curve (Boehm / IBM Systems Sciences Institute, as popularly cited): requirements 1×, design 3–5×, coding ~10×, testing ~15×, production 30–100×.
- NIST 2002 ("The Economic Impacts of Inadequate Infrastructure for Software Testing"): the origin of the widely-cited "~30× more expensive in production" multiplier and the estimate that inadequate software-testing infrastructure cost the US economy roughly $59.5 billion/year.
- ⚠️ Sourcing caveat — flag this explicitly if you use these numbers: The "1×/10×/100×" multipliers and the "IBM Systems Sciences Institute" attribution are weakly sourced. The original IBM SSI chart is difficult to trace to a verifiable primary document, and the multipliers vary enormously by context. The better primary citation is Boehm & Basili, "Software Defect Reduction Top 10 List" (IEEE Computer, 2001), which states that finding and fixing a defect after delivery is "often 100 times more expensive than finding and fixing it during requirements and design" — but Boehm himself (2001) noted this is highly context-dependent, and Agile/CI-CD practices demonstrably flatten the curve. Use directionally, not as a precise constant.
- Why this matters to the thesis: because peer review catches 55–60% of defects before merge, review capacity is the cheapest available gate on the cost curve — so starving review while flooding it with AI-generated volume pushes defects toward the expensive end of the curve.
Section 4: AI-generated code quality
GitClear code-churn / cloning research
- 2025 "AI Copilot Code Quality" report: analyzed 211 million changed lines (Jan 2020–Dec 2024) across anonymized commercial repos plus major open-source projects (incl. Google, Microsoft, Meta).
- Copy/pasted (cloned) lines rose from 8.3% to 12.3% of changed lines (a ~48% relative increase); 2024 was the first year on record where copy/paste exceeded moved (refactored) lines.
- Refactoring collapsed: "moved" lines fell from ~24–25% of changed lines (2020–21) to <10% in 2024 (a 39.9% decrease in moved lines).
- Duplicated code blocks (5+ duplicated lines) rose ~8× during 2024.
- Churn: all-line churn rose from 3.3% (2021) to 5.7% (2024); newly-added lines revised within two weeks rose from ~5.5% (2020) to 7.9% (2024).
- Defect link: cloned/duplicated code is associated with more defects (GitClear cites 15–50% more; one 2023 study found 57.1% of co-changed cloned code involved in bugs).
- ⚠️ Caveat: GitClear is a code-analytics vendor; the study infers AI causation from time-correlation (the rise coincides with Copilot adoption), not controlled assignment.
Security vulnerability rates in AI code (primary/peer-reviewed)
- Veracode 2025 GenAI Code Security Report (100+ LLMs, 80 curated tasks, Java/Python/C#/JavaScript): 45% of AI-generated code introduced a detectable OWASP Top 10 vulnerability (i.e., ~55% average security pass rate). Java worst (72% failure); cross-site scripting (CWE-80) 86% failure. Crucially, the ~45% rate was stable across GPT-4, GPT-5, Claude, and Gemini generations — bigger/newer models did not improve security. Reported ~2.74× more vulnerabilities than human baselines.
- Stanford — Perry, Srivastava, Kumar, Boneh, "Do Users Write More Insecure Code with AI Assistants?" (ACM CCS 2023): 47-participant controlled user study using OpenAI's codex-davinci-002. Participants with AI wrote significantly less secure code AND were more likely to believe their code was secure — the automation-bias pairing. Participants who trusted AI less and iterated on prompts wrote more secure code.
- NYU "Asleep at the Keyboard" — Pearce et al.: ~40% of 1,689 Copilot-generated programs contained security-relevant flaws (C ~50%, Python ~39%).
- Apiiro (2025), Fortune-scale enterprise telemetry: AI-assisted developers generate 3–4× more commits but consolidate them into fewer, larger PRs. By June 2025 AI code introduced 10,000+ new security findings/month — a 10× increase since Dec 2024. Reported 3× surge in repos containing PII/payment data and 10× increase in APIs missing authorization/input validation; a Fortune 50 subset showed 322% more privilege-escalation paths, 153% more design flaws, 40% more secrets exposure. ⚠️ Contested: Contrast Security CTO Jeff Williams disputes Apiiro's 4× velocity / 10× vulnerability magnitude, noting velocity estimates elsewhere range from +10% (Google) to −19% (METR). Treat Apiiro's magnitudes as directional and vendor-sourced.
- CodeRabbit (Dec 2025) analysis of 470 open-source PRs: AI co-authored code had ~1.7× more major issues than human-written code.
Automation bias / complacency in review
- Thoughtworks Technology Radar formally flags "complacency with AI-generated code," warning of automation bias, sunk-cost fallacy, anchoring bias, and review fatigue, and questioning whether faster merge rates reflect quality or over-trust.
- Classic automation-complacency research (Parasuraman et al. 1993, via the McBride/Rogers/Fisk 2014 review): when automation is consistently reliable, operators detect only ~30% of automation errors, versus ~75% when the system visibly fails sometimes. Direct implication for code review: the better AI gets, the worse human reviewers become at catching what it misses ("the automation conundrum," Endsley).
Section 5: The METR RCT (2025)
- Citation: Becker, Rush, Barnes, Rein, "Measuring the Impact of Early-2025 AI on Experienced Open-Source Developer Productivity," METR, July 10 2025 (arXiv:2507.09089).
- Design: Randomized controlled trial; 16 experienced open-source developers, 246 real tasks drawn from their own mature repositories (avg 22,000+ GitHub stars, 1M+ LOC, ~5 years' prior experience on the project). Each task randomly assigned AI-allowed vs AI-disallowed. Primary tool: Cursor Pro with Claude 3.5/3.7 Sonnet. Time self-reported and supplemented by screen recordings; deliverables evaluated via submitted PRs in high-review-standard repos. [5][6]
- Headline result: developers took 19% LONGER with AI allowed — the opposite of the authors' stated prior expectation of a speedup. [6]
- The perception gap: forecast 24% speedup beforehand; estimated 20% speedup even after experiencing the slowdown — a ~39-percentage-point gap between perceived and measured productivity. [6]
- Critiques / limitations to present fairly:
Small n (16), single setting (mature OSS repos with high quality bars and unfamiliar-to-the-tooling workflows).
Learning-curve confound: 56% had never used Cursor; the one developer with 50+ hours of Cursor experience saw a +38% speedup. Simon Willison and Zvi Mowshowitz argue the result may reflect the steep AI-assisted-development learning curve rather than a ceiling on AI's value. (METR's forecasters were told ~25% had prior Cursor experience; actual was ~44%.)
METR's own framing: the result is a "snapshot" of early-2025 tools; as of Feb 2026 METR labels it "historical" and is redesigning the experiment for late-2025 agentic tools (Claude Code, Codex). [7]
Does NOT generalize to junior developers, greenfield work, or unfamiliar codebases — settings where AI tends to help most.
- Small n (16), single setting (mature OSS repos with high quality bars and unfamiliar-to-the-tooling workflows).
- Learning-curve confound: 56% had never used Cursor; the one developer with 50+ hours of Cursor experience saw a +38% speedup. Simon Willison and Zvi Mowshowitz argue the result may reflect the steep AI-assisted-development learning curve rather than a ceiling on AI's value. (METR's forecasters were told ~25% had prior Cursor experience; actual was ~44%.)
- METR's own framing: the result is a "snapshot" of early-2025 tools; as of Feb 2026 METR labels it "historical" and is redesigning the experiment for late-2025 agentic tools (Claude Code, Codex). [7]
- Does NOT generalize to junior developers, greenfield work, or unfamiliar codebases — settings where AI tends to help most.
Section 6: Review latency and queueing (Little's Law / batch size)
- Code review is repeatedly identified as the #1 bottleneck in cycle time (LinearB): in one ~1,000,000-PR study, PRs waited on average 4+ days before pickup; 50% of PRs were idle for >50% of their lifespan.
- Little's Law (WIP = Throughput × Cycle Time, i.e., lead time = WIP ÷ throughput): if verification (review + test) throughput is fixed and you increase WIP (more AI-generated code/PRs), lead time rises proportionally. This is the formal mechanism behind the thesis — more code against fixed review capacity lengthens the queue rather than delivering value faster.
- Reinertsen, Principles of Product Development Flow: large batch size increases cycle time, variability, and risk; queue wait time rises non-linearly (approaching exponential) as utilization exceeds ~80%. AI pushes review/test utilization up while batch sizes grow — the worst combination for flow. [8]
- Swarmia: PR cycle time = time in progress + time in review + time to merge; recommends explicit WIP limits (e.g., ≤10 open PRs) because high WIP correlates with longer delivery.
- Net: the empirical wait-time data (LinearB's "50% idle") plus the queueing math (Little's Law + Reinertsen) together explain why increasing code volume shows up as latency and instability, not throughput.
Section 7: Test coverage and CI/CD capacity as a constraint
- Flaky tests are rising sharply: Bitrise Mobile Insights 2025 (10M+ builds over 3.5 years) — share of teams experiencing flakiness rose from 10% (2022) to 26% (2025), a 160% increase; pipeline complexity rose 23% over the same window.
- Google: ~16% of tests exhibit some flakiness; a large share of "red" builds investigated are false alarms (one widely-cited figure: 84% of pass→fail transitions are flaky, not real regressions — cite with care, as this specific percentage circulates in secondary sources).
- Atlassian: flaky tests caused 21% of master-branch build failures and wasted an estimated 150,000 developer hours/year.
- CI compute: flaky tests estimated to consume ~20% of CI time in some analyses; reruns plus context-switching compound the cost.
- AI's effect on CI load: analysts report test suites that took years to reach ~2,000 tests now grow to 3,000–4,000 in months under AI code generation, while flake rate does not drop — so total flaky failures increase proportionally, partially consuming AI's velocity gains.
- AI-generated tests: quality concerns exist (tests that pass but under-assert, or that lock in incorrect behavior). ⚠️ This is the thinnest-sourced sub-area — treat as an emerging, not established, finding.
Section 8: Ownership clarity and integration environments
- Bird, Nagappan, Murphy, Gall, Devanbu (2011), "Don't Touch My Code! Examining the Effects of Ownership on Software Quality" (ACM ESEC/FSE): studied Windows Vista and Windows 7. Components with many low-expertise ("minor") contributors and a lower ownership share for the top owner had significantly more pre-release faults and post-release failures; the minor-contributor-to-failure relationship was strong (significance >85%). Removing low-expertise contributions dramatically improved contribution-based defect prediction.
- Bird et al. (2009), "Does Distributed Development Affect Software Quality?" (Windows Vista): distributed vs. collocated development showed negligible difference in failures — the salient factor was ownership/expertise, not geography.
- Greiler, Herzig, Czerwonka (Microsoft Research, 2015) replication: confirmed ownership metrics correlate with quality across Office, Exchange, Office365, and Windows, and added that code-review activity is an important, previously-missing dimension of ownership.
- Foucault et al.: found the ownership–quality relationship did NOT fully generalize to all open-source systems — the effect is process-dependent, strongest where strong-ownership policies exist (as at Microsoft). Cite this to keep the ownership claim honest.
- Integration/staging environment availability: widely cited qualitatively as a delivery constraint but lacks a canonical quantitative dataset — flag as under-evidenced if you use it. The DORA capabilities (quality internal platforms, fast feedback loops) are the closest peer-reviewed proxy.
Section 9: Counter-evidence and steelman (AI DID relieve a real constraint)
- GitHub Copilot RCT — Peng, Kalliamvakou, Cihon, Demirer (2023, arXiv:2302.06590): 95 developers recruited on Upwork built an HTTP server in JavaScript. The Copilot group finished 55.8% faster (1h11m vs 2h41m; 95% CI 21–89%; p=0.0017). Benefits were largest for less-experienced, older, and higher-workload developers. This is the cleanest evidence that for well-defined, self-contained, lower-context tasks, generation was a real constraint that AI relieved. [9]
- Microsoft/Accenture/enterprise field experiments — Cui, Demirer, Jaffe, Musolff, Peng, Salz: analyzed 1,974 developers; Copilot access increased the number of tasks completed. ANZ Bank six-week trial: Copilot group 42.36% faster (beginners +52.27%). ZoomInfo (400+ devs): 33% suggestion-acceptance, 72% satisfaction.
- DORA 2025 itself: the throughput relationship turned positive year-over-year, and ~40% of teams (Pragmatic performers + Harmonious high-achievers) achieve high throughput AND stability simultaneously — direct proof the tradeoff is not inevitable when downstream capabilities are strong. [2]
- Enterprise case studies (via DORA 2025 foreword, drawn from Kim & Yegge's Vibe Coding): Adidas reported 20–30% productivity gains (commits, PRs, feature velocity) plus a "50% increase in 'Happy Time'"; Booking.com reported up to 30% more merge requests after training. (Note: these are third-party case studies quoted in the foreword, not DORA survey data.) [2]
- Elastic-review-capacity argument: AI review tools (CodeRabbit, Graphite, etc.) may expand verification capacity, meaning the constraint could itself be elastic. But CodeRabbit's own Dec 2025 data (470 PRs, AI co-authored code with ~1.7× more major issues) shows AI review does not eliminate the underlying quality gap — it shifts, not removes, the verification burden.
- Honest reading: speedups are real for greenfield/boilerplate work, less-experienced developers, and unfamiliar domains; they shrink or reverse for experienced developers in large, high-context, high-quality-bar codebases (METR). That divergence is precisely the "amplifier" pattern.
Section 10: Theory of Constraints applied to software delivery
- Core TOC principle (Goldratt): total system throughput is limited by a single constraint; optimizing a non-constraint yields no throughput gain and typically increases WIP, lead time, and defects. "Spending time optimizing non-constraints will not provide significant benefits; only improvements to the constraint will further the goal."
- Direct application to AI coding (2025–2026 analyses): "Optimizing a non-bottleneck step (code generation) does not improve system throughput when the bottleneck step (code review and human approval) remains unchanged. Writing and testing code accounts for roughly 25–35% of the total SDLC; the remainder is review, requirements understanding, debugging, meetings, and documentation. AI tools are currently optimizing the minority share of the pipeline while increasing the burden on the majority share."
- The failure cascade (TOC applied): more code → larger deployments → higher change-failure rate → more fixes and retesting → growing release queue → eventual big-bang releases / code freezes. "The bottleneck is not developer productivity."
- Constraints move, they don't vanish: classic TOC teaching that elevating one constraint reveals the next. AI elevated the code-generation "constraint" and exposed review, test, integration, and ownership as the true binding constraints — the literal claim in the post's title.
Overall synthesis for the author
The evidence supports the thesis with one refinement worth stating for credibility: code generation was a real constraint for some work — greenfield, boilerplate, junior developers, unfamiliar domains — which is why controlled trials (Copilot RCT, 55.8% faster) show genuine speedups. But for experienced teams in mature systems, generation was rarely the binding constraint, and increasing code volume against fixed verification capacity manifests as instability (DORA), longer review latency (Faros: PR review time +91%, later +441%), more churn and duplication (GitClear), and more security findings (Veracode 45%, Apiiro 10×) — not durable end-to-end velocity.
The two strongest pillars are DORA's own 2025 conclusion ("AI accelerates software development, but that acceleration can expose weaknesses downstream… an increase in change volume leads to instability") and the METR RCT (19% slower, with a 39-point perception gap). The most defensible version of the post concedes the Copilot RCT speedups and DORA's 2025 throughput reversal — then argues that both are consistent with the "moved, not removed" thesis: the constraint is relieved end-to-end only when review, testing, version control, and platform capabilities scale alongside generation. Where they don't, AI amplifies the existing bottleneck rather than removing it.
Source-quality quick reference
- Strongest (peer-reviewed / RCT / primary): METR RCT (arXiv:2507.09089); GitHub Copilot RCT (arXiv:2302.06590); Stanford CCS 2023; Pearce et al. (NYU); Bird et al. 2011 & Greiler et al. 2015 (ownership); Boehm & Basili 2001.
- Strong industry with disclosed methodology: DORA 2024 & 2025 (self-reported, correlational — flag); Veracode 2025 (100+ LLMs, 80 tasks); SmartBear/Cisco 2006.
- Directional / vendor-sourced (attribute and hedge): GitClear (correlational), Apiiro (contested magnitudes), Faros AI, LinearB, Bitrise, CodeRabbit.
- Flag as weakly sourced if used: the "1×/10×/100×" cost-to-fix curve and IBM Systems Sciences Institute attribution; the 87%→28% PR detection-decay figure; the "84% of red builds are flaky" stat; integration/staging-environment scarcity (qualitative only).
- DORA — https://dora.dev/research/2024/dora-report/
- google — https://services.google.com/fh/files/misc/2025_state_of_ai_assisted_software_development.pdf
- google — https://cloud.google.com/blog/products/ai-machine-learning/announcing-the-2025-dora-report
- Hubspotusercontent-na2 — https://243608892.fs1.hubspotusercontent-na2.net/hubfs/243608892/AI_Engineering_Impact_Report_July_2025_Faros_AI.pdf
- arxiv — https://arxiv.org/pdf/2604.16399
- METR — https://metr.org/blog/2025-07-10-early-2025-ai-experienced-os-dev-study/
- ScienceBlog — https://scienceblog.com/t-a-randomized-trial-by-metr-found-that-experienced-developers-completed-real-coding-tasks-19-slower-when-allowed-to-use-ai-tools-yet-afterwards-they-estimated-on-average-that-ai-had-made-them-20-fast/
- Projectproduction — https://projectproduction.org/journal/littles-law-a-practical-approach-to-understanding-production-system-performance/
- Cut The SaaS + 2 — https://cut-the-saas.com/ai/generative-ai-impact-on-developers-increased-productivity-and-faster-task-completion
EDITORIAL BRIEF
Commissioned from our research desk. Subject to final editorial discretion.
The bottleneck AI coding assistants moved rather than removed. Argue that generating code was rarely the constraint—review capacity, test coverage, integration environments, and ownership clarity were—and that increasing code volume against a fixed verification capacity shows up as change failure rate and review latency, not velocity. Pull from DORA's findings on AI adoption correlating with throughput gains alongside stability declines, plus data on PR size versus review quality and defect escape rates. Takeaway: measure the second-order constraint before you claim a productivity win, and fund verification infrastructure as part of any AI tooling rollout.