The proof is indisputable.
Why do two engineering orgs with similar headcount, stacks, and problems end up with wildly different operational lives? One agreed on what "ready for production" means. The other let every team decide for itself.
Sounds too small to matter. It compounds in ways that stay invisible until they aren't.
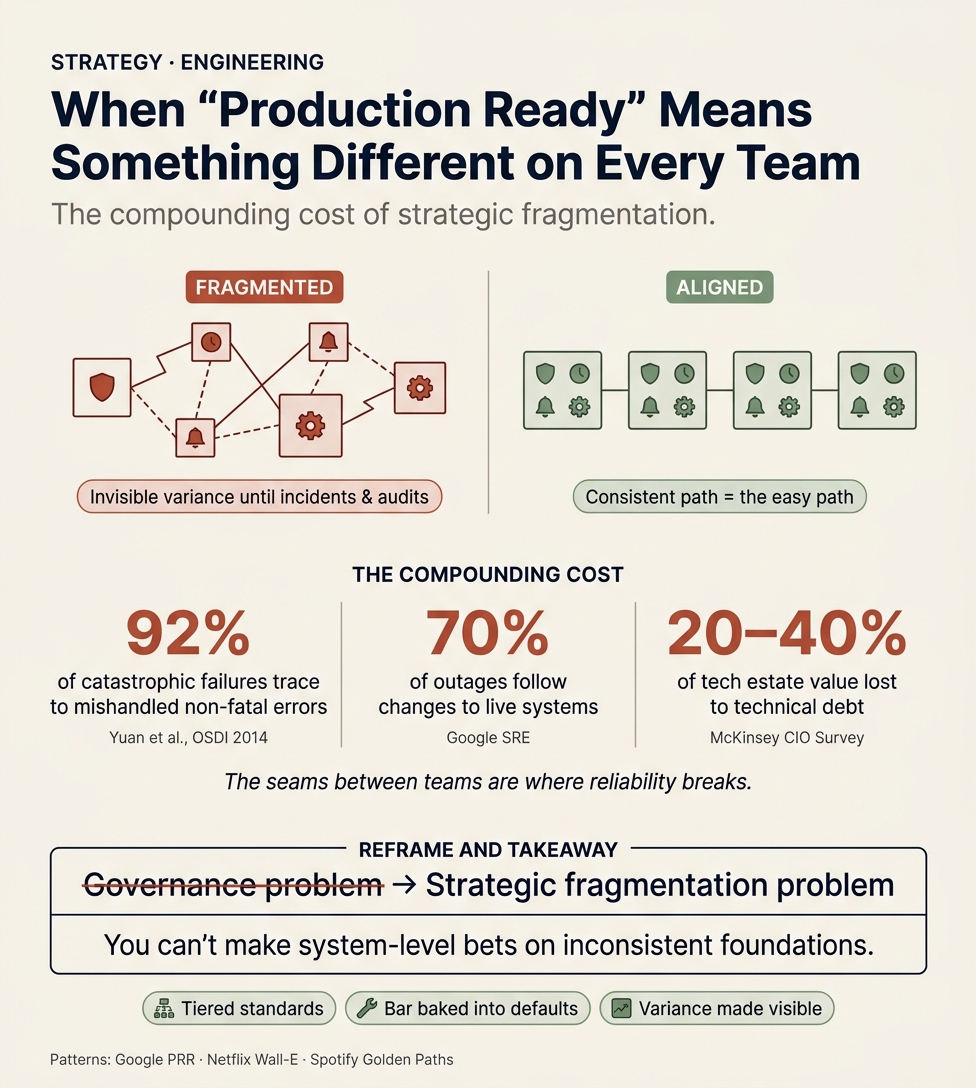
When each team sets its own bar for what's shippable, you don't see the variance during normal operation. You see it during incidents and audits, when one component's actual behavior gets tested against another's assumptions. The Yuan et al. study of distributed systems (OSDI 2014) found that 92% of catastrophic failures came from incorrect handling of non-fatal errors. Error handling is the literal seam between services, which means it's also the seam between teams and the assumptions they each carry. Google SRE puts roughly 70% of outages on changes to live systems, the same story from a different angle.
The cost is not subtle. McKinsey's survey of CIOs at billion-dollar firms puts technical debt at 20 to 40% of the value of the entire technology estate, with about a third of CIOs reporting that more than 20% of new-product budget gets quietly diverted into servicing it. Stripe found developers losing roughly a third of their time to maintenance. Most of that isn't bad code in any single place. The friction comes from integrating things built to different standards.
I want to be careful here, because the easy reading is "we need better governance." That's not quite the diagnosis. Governance asks whether a team followed a rule. The strategic question is different: can we make a confident bet on this system? If Service A has SLOs, runbooks, and on-call, and Service B is best-effort with no documentation, you cannot reason about the reliability of anything that chains them. You cannot set a company-wide SLO, estimate blast radius, or price a platform investment honestly. Fragmentation erodes the information you need to make portfolio-level decisions before any engineering question comes up.
The teams that have worked this out, Google with Production Readiness Reviews, Netflix with Wall-E, Spotify with Golden Paths, did not solve it with a heavier checklist. They made the consistent path the easy path. A tiered standard so a marketing page and a payments service face proportionate, not identical, bars. A platform that bakes the bar into default tooling, so doing the right thing is the path of least resistance. Variance made visible through scorecards and error budgets, so the conversation happens before the incident, not during it.
The question I'd ask any leader sitting on a portfolio of services: how much of your strategy quietly depends on the assumption that your systems behave consistently, and how much evidence do you actually have for that assumption?
The Compounding Cost of Having No Shared Definition of "Production Readiness"
TL;DR
- When every engineering team invents its own bar for "shippable," the result is invisible variance across reliability, security posture, and operational burden that stays hidden in normal operations and becomes expensive precisely during incidents and audits. The strongest hard evidence: Google SRE finds roughly 70% of outages are triggered by changes to a live system, and a landmark academic study (Yuan et al., OSDI 2014) found 92% of catastrophic distributed-system failures stem from incorrect handling of non-fatal errors — the exact "seam" code where teams' differing assumptions meet.
- This is best framed as a STRATEGIC FRAGMENTATION problem, not merely a governance/compliance one: when each component has unknown and varying reliability/security/operational characteristics, leaders cannot make confident system-level bets or platform investments. McKinsey CIOs estimate technical debt equals 20–40% of total technology-estate value, and 30% of CIOs say more than 20% of new-product budget is diverted to resolving debt; Stripe found developers lose roughly a third of their working time to bad code and maintenance.
- The fix the data supports: a shared, tiered production-readiness standard (Google's Production Readiness Review model) operationalized as "paved roads"/"golden paths" inside an internal developer platform — making the consistent path the easy path rather than imposing a compliance checklist after the fact.
Key Findings
1. Production-readiness reviews and what "good" looks like
- The Production Readiness Review (PRR) originates from Google SRE. Production readiness is defined as ensuring components meet security, reliability, and performance standards before and during production (Google SRE book; Port.io).
- Google's PRR (also called the SRE Entrance Review) evaluates a service across four axes — extant bugs, reliability, automation, and monitoring/alerting — and produces a prioritized list of "blockers" that must be fixed before SRE will take on-call ownership (Google Cloud, "How SREs find the landmines in a service").
- Good checklists typically span ~7 dimensions: service levels/SLOs, architecture review, performance, documentation, observability, testing, and deployment strategy (open-source Production Readiness Checklist project).
- The recurring expert warning: "the same bar should apply to every service, not just the 'critical' ones." Absent that, teams make ad hoc "ship it" decisions that don't scale, and "velocity turns into chaos" (DX / getdx.com).
- Google distinguishes the PRR from "definition of done" / product readiness — production readiness is continuous, because a service that was production-ready at scaffolding will degrade as requirements change (Port.io).
2. The variance is invisible until incidents or audits
- Roughly 70% of outages are caused by changes to a live system (new config, feature launch, new traffic type). Verbatim, from the Google SRE Workbook Error Budget Policy: "Changes are a major source of instability, representing roughly 70% of our outages." Changes are where one team's assumptions collide with another's — and the mismatch only surfaces on push. [1]
- Google's own canonical example: a configuration change that used an untested keyword/feature combination passed through a "low-risk," less-stringent canary process and caused a near-global internal outage. The variance in rigor between the standard path and the lighter path was invisible until it failed (Google SRE, Emergency Response chapter).
- Verica VOID (Verica Open Incident Database): only about a quarter (≈25%) of incident reports follow any form of root-cause analysis or explicitly identify a root cause, and fewer than 0.5% (only nine reports) are near-miss reports. Most organizations therefore have poor visibility into latent variance until it becomes a customer-facing event (VOID 2022 report; InfoQ interviews with Courtney Nash).
3. Incident attribution to integration boundaries and inconsistent operational standards
- Yuan et al., "Simple Testing Can Prevent Most Critical Failures" (USENIX OSDI 2014; 198 production failures across Cassandra, HBase, HDFS, Hadoop MapReduce, Redis): 92% of catastrophic failures result from incorrect handling of non-fatal errors that were explicitly signaled in software; ~58% could be caught by simple testing of error-handling code (35% trivial enough to catch by code inspection alone, plus 23% by 100% statement-coverage testing of the error-handling path). Error-handling is precisely the seam between components and teams.
- Gao et al., "An Empirical Study on Crash Recovery Bugs in Large-Scale Distributed Systems" (ESEC/FSE 2018; 103 bugs in ZooKeeper, Hadoop MapReduce, Cassandra, HBase): the crash-handling component is the most error-prone at 34%; 97% of crash-recovery bugs involve no more than four nodes — i.e., failures emerge at the interaction/recovery seams between a few nodes, not only at massive scale.
- Gunawi et al., "Why Does the Cloud Stop Computing?" (ACM SoCC 2016; 597 unplanned outages across 32 popular Internet services): includes an explicit "CROSS" root-cause category for outages caused by disruptions from other services (cross-service/dependency failures). Among outages with a known cause, the leaders were upgrades, network, and bugs. The thesis: avoiding single points of failure "is not merely about redundancies, but rather about the perfection of [the] failure recovery chain."
- Gremlin 2021 State of Chaos Engineering (400+ technologists): the most common causes of SEV0/SEV1 incidents were bad code pushes and dependency issues — explicitly noting that "a bad code push from one team can cause a service outage for another." [2]
- Inconsistent operational standards (logging, monitoring, alerting, runbooks, retries, timeouts): Google SRE documents retry storms, missing/oversized RPC deadlines, and mismatched timeout/retry behavior as classic cascading-failure triggers — all of which arise from teams setting these parameters independently. Uptime Institute (2024/2025 Annual Outage Analysis) attributes the rise in IT/networking outages (23% of impactful outages in 2024) to "change-management issues and misconfigurations" from increased complexity, and reports that 80% of operators believe better management, processes, and configuration would have prevented their most recent outage.
- Microsoft Azure high-severity incident study (Liu et al., 2018 data): software bugs were the single most common cause, ~40% of incidents — dominated by data-format, fault-related, and timing bugs, which are characteristically interaction/boundary defects.
4. Security posture variance (weakest-link dynamic, audit findings)
- Verizon 2025 DBIR (22,052 incidents, 12,195 confirmed breaches): 60% of breaches involve the human element; third-party involvement doubled to 30% (from 15% the prior year); 22% of breaches began with stolen credentials and 20% with exploited vulnerabilities. The median time to remediate leaked secrets in a GitHub repository was 94 days.
- Verizon 2026 DBIR: the human element held steady at 62%; new data from inside third-party cloud environments shows weak passwords and excessive permissions take nearly eight months (median) to remediate — "problems that have been on every security framework checklist since 2005." Developers and system admins cause misconfiguration errors with disproportionate blast radius ("a misconfigured S3 bucket exposes more records than a misaddressed email"). [3]
- The weakest-link / inconsistency dynamic, quantified: In the Snowflake-customer campaign, at least 79.7% of the accounts the threat actor used had prior credential exposure (Mandiant/Google Cloud UNC5537 report, June 10 2024), with the earliest infostealer infection dating to November 2020 and ~165 of Snowflake's 9,000+ customers affected. Verizon notes the attack succeeded largely because MFA was not mandatory at the provider — an inconsistent security bar across vendors/teams created the gap.
- DORA 2022 (Accelerate State of DevOps): the biggest predictor of an organization's application-development security practices was cultural, not technical — high-trust, low-blame cultures adopted emerging security practices far more than low-trust, rules-focused ones. Teams with high security practices are 1.6x more likely to have high organizational performance. This argues that a consistent, low-blame security culture — not point tools — drives posture. [4]
5. The compounding / accumulation dynamic
- Normalization of deviance (Diane Vaughan, from the Challenger investigation): a clearly unsafe practice becomes culturally accepted as normal when it doesn't immediately cause catastrophe — "a long incubation period [before a final disaster] with early warning signs that were either misinterpreted, ignored or missed completely." Critically, each iteration's "acceptable" baseline is the previous deviation, so the standard silently ratchets. In software this is skipping tests, ignoring reviews, and deploying untested changes until they become the de facto norm. [5]
- Technical-debt economics (McKinsey, "Tech debt: Reclaiming tech equity," Oct 2020; survey of ~50 CIOs at $1B+ firms): CIOs estimate tech debt amounts to 20–40% of the value of their entire technology estate before depreciation; 30% of CIOs believe more than 20% of their new-product technical budget is diverted to resolving tech debt; and 60% felt their tech debt had risen perceptibly over the prior three years. Actively managing it can free engineers to spend up to 50% more time on value-generating work (one cloud-provider CIO went "from 75% of engineer time paying the [tech debt] 'tax' to 25%").
- Stripe 2018 Developer Coefficient (300+ teams): developers spend more than 17 hours per week on maintenance issues (debugging, refactoring) plus ~4 hours on bad code — a ~31.6% efficiency loss, which Stripe equated to roughly $300B in lost global GDP annually.
- Per-team variance accumulates like compounding interest: each inconsistent integration, undocumented service, and bespoke operational standard raises the effective "interest rate" on the whole system, and older codebases pay more per workaround as entropy accrues.
6. Strategic-fragmentation framing
- Conway's Law: any organization that designs a system produces a design whose structure mirrors the organization's communication structure. Ruth Malan's corollary: "If the architecture of the system and the architecture of the organization are at odds, the architecture of the organization wins." Fragmented, siloed teams therefore produce fragmented, inconsistent systems by default.
- Team Topologies (Skelton & Pais): platform teams exist explicitly to reduce cognitive load by providing self-service capabilities; the inverse-Conway maneuver organizes teams to produce the architecture you want, rather than mandating an architecture onto mismatched teams. [6]
- Paved roads / golden paths (Netflix "Paved Road," Spotify "Golden Path"): Spotify created Golden Paths specifically to combat "fragmentation among our toolsets and engineering practices" that had produced "rumour-driven development" (where "the only way to find out how to do something was to ask your colleague"). Netflix's Wall-E platform made security best practices the default — "it didn't just tell developers what to do; it did it for them." This is consistency-by-design rather than consistency-by-audit. [7][7]
- DORA 2024: internal developer platforms improve individual, team, and organizational performance and produce more consistent deployment practices — but can decrease change stability and throughput if implemented poorly, so standardization must be designed for developer independence, not as a bottleneck. [8][8]
- The stakes, quantified: ITIC 2024 Hourly Cost of Downtime Survey — the average cost of a single hour of downtime exceeds $300,000 for over 90% of mid-size and large enterprises, and 41% put it at $1M–$5M+ per hour. Uptime Institute — 54% of respondents' most recent significant outage cost more than $100,000, and 16% more than $1 million. [9]
Details
The core mechanism is this: a shared definition of "production ready" is a system-level contract about the reliability, security, and operational characteristics that every component will exhibit. When that contract is absent and each team sets its own bar, the variance is real but unobservable during steady-state operation. It surfaces at the worst possible moments — incidents and audits — because those are exactly when one component's actual (not assumed) characteristics are tested against another's expectations.
The integration-boundary evidence is the strongest empirical anchor. Yuan et al.'s 92% finding concerns error-handling code, which is the literal seam where one service's failure must be correctly interpreted by the next. When teams hold inconsistent standards for error handling, retries, and timeouts, those seams become the dominant source of catastrophic failure — and Google SRE's independent documentation of retry storms and missing deadlines confirms the same failure modes from operational experience. The Gunawi "CROSS" category and Gremlin's "dependency issues" finding are the most direct (if less precisely quantified) confirmations that cross-team/cross-service boundaries are where outages concentrate.
The strategic argument follows directly. Portfolio-level reasoning requires knowing the characteristics of each component. If Service A is "99.9%, with runbooks, SLOs, and on-call" and Service B is "best-effort, no on-call, undocumented," a leader literally cannot reason about the reliability of a system that chains them — and therefore cannot confidently place a platform bet, set a company-wide SLO, or estimate the blast radius of a new feature. Fragmentation erodes the information required for system-level investment decisions. That is why this is strategic, not merely governance: governance asks "did you follow the rule?"; strategy asks "can we make confident bets on this system?" The McKinsey data makes the strategic cost concrete — when 20–40% of the technology estate's value is debt and a large share of new-product budget is silently diverted to servicing it, the organization's capacity to make any deliberate system-level investment is already compromised before the first line of new code is written.
Recommendations
- Establish one tiered, shared definition of production readiness — not one-size-fits-all. Adopt the Google PRR dimensions (SLOs, observability, alerting, runbooks, deployment/rollback, error handling, security review) with tiers by criticality, so a marketing page and a payments service face proportionate, not identical, bars. Benchmark: every production service maps to a tier and demonstrably meets that tier's bar.
- Operationalize it as a paved road, not a checklist. Bake the standard into an internal developer platform / golden path so the compliant path is the easiest path (Netflix Wall-E, Spotify Backstage). Threshold to escalate platform investment: when three or more teams are independently maintaining bespoke versions of the same capability (CI, auth, observability), fund a platform team to own it.
- Make the variance visible. Track open vs. completed readiness reviews and per-service scorecards in a developer portal; use error budgets to force the reliability conversation whenever a service exceeds its budget, converting invisible variance into a managed signal.
- Treat the security bar as a system property, set by the weakest link. Mandate secure-by-default settings platform-wide (mandatory MFA, automated secret scanning, least-privilege defaults). The Snowflake and DBIR data show the organization's effective security posture equals its least-rigorous team's bar.
- Measure and pay down variance as debt. Use three metrics — maintenance load (% non-feature time), change failure rate, and lead time for changes — and allocate a fixed sprint percentage (commonly 15–20%) to consistency/debt work. Change the plan if maintenance load climbs quarter-over-quarter, which signals debt accumulating faster than it is being retired.
Caveats
- No single authoritative study reports "X% of incidents originate at integration boundaries." The 92% figure (Yuan et al., 2014) is specifically about incorrect handling of non-fatal errors and relies on a broad definition of "error handling"; it should be cited precisely as such, not as "92% of failures happen at APIs." Reviewers (e.g., Murat Demirbas) note that in exception-based languages nearly any fault can be classified as an error-handling problem.
- Several vendor figures are marketing-adjacent (downtime cost-per-minute estimates; Gremlin's claim of testing "the failures behind 80% of outages") and should be treated as directional rather than peer-reviewed.
- The VOID's central message is that single root causes are largely a myth — incidents are multi-factor sociotechnical events. This usefully complicates any clean "root cause = inconsistency" attribution; inconsistency is better described as a contributing factor that widens blast radius and slows diagnosis.
- DORA explicitly cautions against using its metrics for cross-team league tables. The goal is consistency of standard, not uniformity that suppresses legitimate domain differences (a data-science workflow legitimately differs from a frontend one). Paved roads should have "optional exits" / well-documented escape hatches.
- Downtime-cost and tech-debt percentages vary widely by source, year, and methodology; ranges are reported where sources conflict (e.g., Stripe's 23–42% maintenance-time range; downtime estimates from $5,600/min legacy Gartner figures to $14,056/min in 2024 EMA research).
- The widely circulated claim that "McKinsey projects tech debt will cost $5 trillion by 2030" could not be verified against a primary McKinsey source and has been omitted; the verified McKinsey figures (20–40% of estate value; 30% of CIOs; up to 50% time freed) are used instead.
- Google — https://sre.google/workbook/error-budget-policy/
- Gremlin — https://www.gremlin.com/state-of-chaos-engineering/2021
- Symmetry Systems — https://www.symmetry-systems.com/blog/8-completely-unsurprising-findings-from-the-2026-verizon-dbir/
- DORA — https://dora.dev/research/
- Medium — https://medium.com/@kaklotarrahul79/normalization-of-deviance-in-software-how-broken-practices-become-standard-b244cd6b0aaa
- Wind4Change — https://wind4change.com/team-topologies-matthew-skelton-conway-law-cognitive-load-theory/
- InfoQ — https://www.infoq.com/news/2021/03/spotify-paved-paths/
- DORA — https://dora.dev/research/2024/dora-report/
- Itic-corp — https://itic-corp.com/itic-reports-surveys/
Commissioned from our research desk. Subject to final editorial discretion.
The compounding cost of having no shared definition of 'production readiness' across teams. Cover how each team inventing its own bar for what's shippable creates invisible variance in reliability, security posture, and operational burden that only surfaces during incidents or audits. Research data on incident attribution to integration boundaries and inconsistent operational standards. The takeaway is that this isn't a governance problem—it's a strategic fragmentation problem that erodes your ability to make system-level bets.