A few weeks ago I sat in a room where the executive team was asking why a customer cohort was churning faster than expected. Marketing had a theory, product had a theory, sales had a theory. Then an engineer mentioned that those same customers had been hitting a higher error rate on a specific workflow for six weeks. Nobody at the table had seen that data, because it lived in a dashboard only engineers read.
That moment has been bothering me ever since.
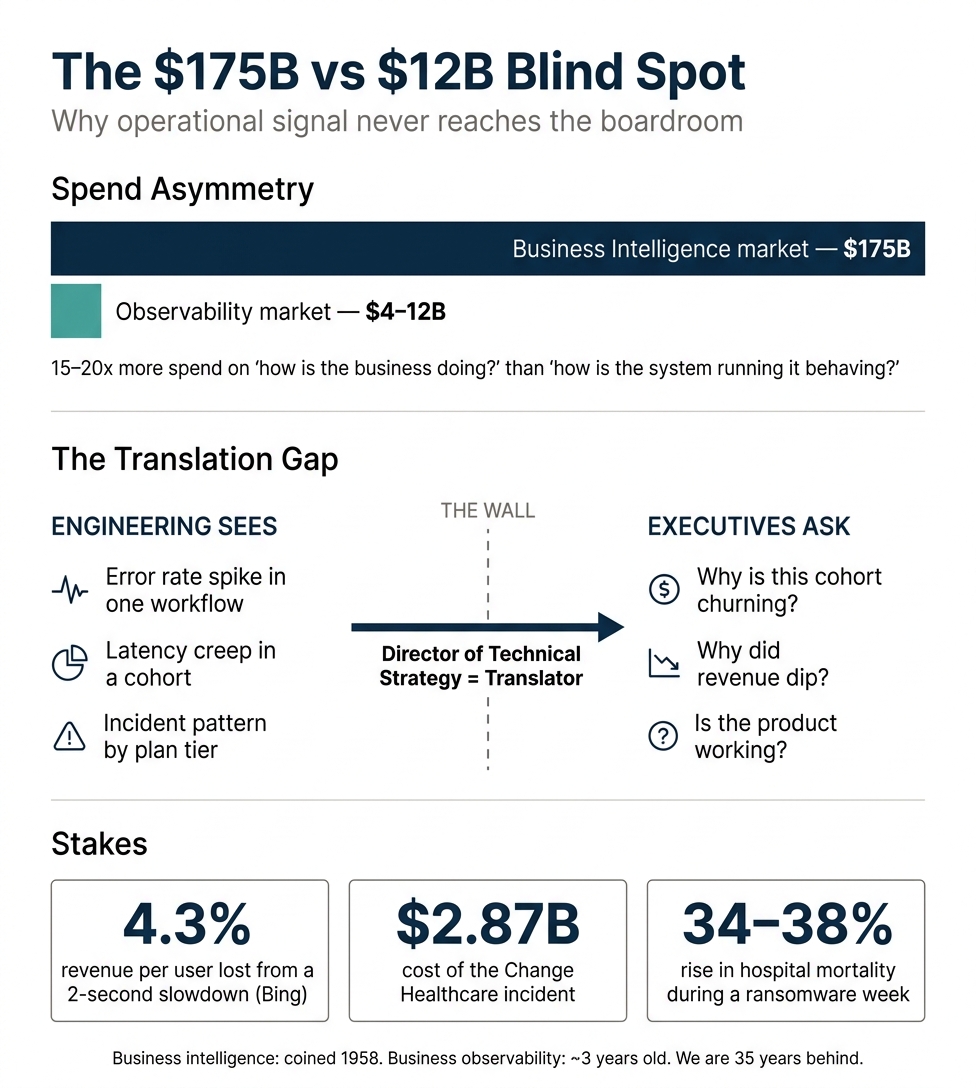
Over thirty-five years, we have built an executive apparatus for business intelligence. Most large organizations have a Chief Data Officer, analytics teams, and budgets sized for the whole company to consume the output. Gartner pegs the data and analytics software market at about $175B. The observability market is $4 to $12B. The muscle for "how is the business doing?" is fifteen to twenty times larger than the muscle for "how is the system running the business actually behaving?"
And observability often eats 20 to 30% of cloud infrastructure spend. We pay handsomely to produce operational signal, then leave it where only engineers can read it.
SLOs, error budgets, and incident patterns are more than engineering hygiene. Sliced by customer segment, plan tier, or workflow, they become some of the earliest leading indicators a company has. Bing learned that a two-second slowdown drops revenue per user by 4.3%. Capital One has written that translating technical metrics into customer impact is tribal knowledge living with a few engineers, so during an incident the people who could explain business impact are often unheard.
In healthtech, the stakes are sharper. The Change Healthcare incident cost UnitedHealth $2.87B and disrupted care at roughly three quarters of U.S. hospitals. Peer-reviewed work suggests in-hospital mortality rises 34 to 38% during a ransomware week. Reliability arrives as a clinical, regulatory, and financial signal at once, and engineering sees it first.
So when I think about what a Director of Technical Strategy is actually for, more and more of the answer is translation. The job is to take signal already screaming inside engineering, the cohort silently degrading, the latency creep before a churn wave, the error pattern mapping onto a customer segment, and put it in front of people who make portfolio, pricing, and product decisions.
"Business intelligence" was coined in 1958. "Business observability" is perhaps three years old, and only about 40% of organizations have started. We are thirty-five years behind on treating the operational layer as foresight rather than postmortems.
That gap is one of the most underpriced strategic opportunities inside most companies today. The data is already being collected. The bill is already being paid. The only thing missing is someone whose job is to carry it across the wall.
The strategic cost of siloed observability: a research overview
This research overview compiles data, frameworks, case studies, and expert perspectives on the strategic cost of treating observability and reliability as purely engineering-owned concerns rather than as business intelligence. It is organized into the two areas requested: (1) the business signal trapped in engineering dashboards, and (2) the spending and consumption gap between business analytics and operational analytics. A healthtech-specific section follows, given the author's industry context.
1. Operational signal trapped in engineering dashboards
1a. Established frameworks linking reliability to business outcomes
Google SRE / Customer Reliability Engineering. The foundational Site Reliability Engineering book (Beyer, Murphy, Jones, Petoff, 2016) frames reliability as an explicit business question: "If we were to build and operate these systems at one more nine of availability, what would our incremental increase in revenue be? Does this additional revenue offset the cost of reaching that level of reliability?" The error-budget model — SLO = target reliability, error budget = (1 − SLO) — was designed as a "common, data-driven mechanism for assessing launch risk" [1] between engineering and product. Google's "Four Golden Signals" (latency, traffic, errors, saturation) were defined as the minimum translation layer to user/business impact. [2] The Google CRE Life Lessons blog explicitly recommends calibrating SLOs against revenue: "If a 50% error budget overspend corresponds to a 1% decrease in customer revenue, then you may feel that you can adjust your SLO target." [3]
Honeycomb's "Observability 2.0." Charity Majors (Honeycomb CTO) defines Observability 2.0 as a single source of structured wide events from which all other telemetry is derived, explicitly framing observability as "B.I. tooling for software applications." [4] Key quotes:
- "Your beautiful nines don't matter if your users are not happy." [5]
- "The goal of good observability is to help engineers understand their software in the language of the business." [6]
- "What the business and marketing side of the house has had these data analytics capabilities for 20 years already… we're kinda playing catchup when it comes to some of this stuff, that is a little bit embarrassing."
- "The longer-term goals for observability involve unifying not just data for engineering, but for product analytics, business forecasting, marketing segmentation… There's so much waste going on all over the org by storing these in siloed locations."
Liz Fong-Jones (Honeycomb Field CTO, ex-Google CRE): "Repeat after me, SLOs reflect business value." [7] She quotes CircleCI's Rob Zuber: "If your SLO doesn't come with that stakeholder agreement, or if it doesn't tell you something useful about the customer experience, it's not an SLO. It's just a metric." [8][9]
Alex Hidalgo (Implementing Service Level Objectives) defines SLIs as "a metric, a bit of telemetry that tells you whether or not your users are having a good experience" [10] and argues that the best SLOs require "shared understanding between product and engineering about what the business goals of the system are." [10] He notes the best SLOs are calibrated over months or years against customer feedback, not chosen by engineering preference.
DORA / Accelerate research. DORA's research model maps engineering capabilities → software delivery and operations performance → organizational outcomes (profitability, market share, customer satisfaction, productivity). Reliability was added as the fifth metric in 2024. DORA documentation explicitly states the metrics "can be viewed as both leading and lagging indicators." [11] Across a decade of research and >39,000 surveyed professionals, elite performers are 2x more likely to meet or exceed organizational performance goals including profitability, productivity, market share, and customer satisfaction; the 2018 Accelerate findings showed elite teams deploy 46x more frequently, [12] recover 2,604x faster, and have 7x lower change failure rates. The 2024 DORA Report found teams with high-quality documentation are >2x more likely to meet reliability targets [13] — and counterintuitively that AI tooling correlated with −1.5% throughput and −7.2% stability.
Gartner's "Applied Observability" (2022) and "Business Observability." Gartner's IOCS 2025 guidance: observability must be "elevate[d]… beyond infrastructure metrics and toward business relevance… aligning observability to services, customer journeys, and KPIs or risk eroding confidence and adoption." [14] AWS's Well-Architected framework (OPS04-BP01) explicitly states "It's often more straightforward to identify an issue using a business KPI" than technical metrics, classifying the risk of not implementing this as HIGH.
1b. Empirical evidence: latency and reliability as revenue leading indicators
The empirical literature linking system performance to business outcomes is unusually consistent across two decades:
| Study | Finding |
|---|
| Amazon (Linden, 2006) | Each 100ms of latency = ~1% drop in sales (A/B test)Conductor |
| Google Search (Mayer, 2008) | 500ms slowdown = 20% drop in traffic and revenueGigaSpaces |
| Google Search (Brutlag, 2009) | 400ms delay = −0.59% searches/user;−0.21% persistent effect after delay removedMvdirona |
| Bing (Schurman, 2009) | 2-second slowdown = −1.8% queries,−4.3% revenue per userMvdirona |
| Akamai/SOASTA (2017, ~10B visits) | 100ms delay = up to 7% mobile conversion drop; 2-sec delay = 103% bounce rate increaseAkamai |
| Walmart | Each 1-second improvement = 2% conversion increaseRetisioWpostats |
| Deloitte "Milliseconds Make Millions" (2020) | 0.1-sec mobile speed improvement = 8.4% retail conversion lift, 10.1% travel |
| Pinterest (2017) | 40% wait-time reduction → +15% SEO traffic, +15% signup conversionHobo-Web |
| Vodafone (2021) | 31% LCP improvement → 8% sales increaseSite Builder Report |
| Renault (2021) | 1-sec LCP improvement → 13% conversion liftSite Builder Report |
| Google/Harris Poll (2022) | Search abandonment costs U.S. retailers**$300B+ annually**; 48% of failed searchers buy from a competitorGoogle Cloud |
The Brutlag persistence finding is particularly relevant to the "leading indicator" framing: degraded reliability leaves a measurable behavioral residue even after the technical issue is resolved. Bing's data is the clearest example of latency as a revenue signal that engineering owns but business cannot see — the 4.3% revenue-per-user drop emerged in engineering A/B logs months before it would surface in any quarterly business review.
Caveat: the Amazon "100ms = 1%" stat originated as a Linden blog post, not peer-reviewed; [15] the Akamai/Forrester 2009 stats are stated-preference survey data. Treat individual numbers as directional. The pattern across studies is what matters.
1c. Customer-cohort and segment-level reliability as a business signal
The most consequential framing — and the most under-utilized one — is that reliability data, when sliced by customer dimension, is a per-segment leading indicator of churn, expansion, and product-market fit.
Honeycomb's high-cardinality approach. Honeycomb is purpose-built to slice telemetry by customer ID, plan tier, geography, and other high-cardinality fields. Majors: "Users are usually the highest cardinality dimension in your data set… finding that 500th user that's doing something crazy or bad or having a terrible experience might make or break your business." [16] The IDC TEI of Honeycomb customers found 77% faster performance-related queries and 79% faster issue remediation [17] when teams could pivot reliability data along customer dimensions.
Pinterest as canonical case. A 2015 segment analysis found Pinterest's mobile site converted only 1% of unauthenticated users versus 5x that on desktop [18] — a reliability/speed signal that revealed mobile as the actual product-market-fit problem. The 2017 production rewrite delivered a 40% wait-time reduction and +15% signup conversion plus +15% SEO traffic, [19][20] driving Pinterest's largest user-acquisition gain of 2016. The 2018 PWA: time-to-interactive cut from 23s → 5.6s; [18] weekly mobile-web actives +103% YoY; [18] ad revenue +44%. [21]
Birdie (UK home-care platform). Used Honeycomb to slice performance and error data across customer cohorts, citing 50% observability cost savings [22] and faster debugging tied directly to "ensuring customers can provide seamless and timely care to in-home patients." [22]
Home Depot's VALET framework (Volume, Availability, Latency, Errors, Tickets). Used to instrument 800+ services [23] with explicit per-service SLOs evaluated alongside business metrics like purchase volumes, documented in the Google SRE Workbook.
Capital One's customer-journey graphs. Capital One Tech (Sheth and Kanniyappan): "A key challenge with current observability implementations is their predominantly engineering-centric design… the expertise required to correlate these metrics with actual customer impact is often tribal knowledge that resides solely with engineers. This lack of transparency delays incident resolution and poses significant risks during incidents when key subject matter experts are unavailable." [24] Capital One built automated journey graphs so the first step in every incident is "measuring impact" [24] from the customer journey down — not from infrastructure up.
AHA Change Healthcare data (2024). Hospital impact varied dramatically based on "amount of cash reserves, vendor redundancy, and reliance on Change Healthcare technology" — i.e., reliability data sliced by customer cohort would have revealed which segments were structurally more exposed before the incident.
1d. Forrester TEI evidence linking observability to business outcomes
Vendor-funded but methodologically consistent:
- Elastic Observability TEI: 243% 3-year ROI, $11.12M NPV, [25] citing "improved business continuity" and "increased customer retention." [26]
- Cisco Full-Stack Observability TEI: 359% ROI; 60% reduction in major outage length by year 3; 90% reduction in war-room triage time. [27]
- New Relic TEI (Feb 2025): 267% ROI, $5.1M NPV. [28]
- Chronosphere TEI: 165% ROI; [29] 75% reduction in critical incidents; 40% data reduction. [29]
- Dynatrace TEI: outage reduction directly correlated with "growth in customer acquisition and retention." [30]
These studies are positively biased (vendor-commissioned, small composites) but the consistent pattern — observability ROI flowing through customer retention and revenue, not just engineering productivity — is what matters.
2. The spending and consumption gap: business analytics vs operational analytics
2a. Market size asymmetry
The market sizing varies by analyst definition, but the magnitude of the gap is the headline.
Data and analytics software (Gartner umbrella, 2024): $175.17B, up 13.9% YoY. Fastest-growing subsegments: Data Science & AI Platforms (+38.6%), Non-relational DBMS (+22.7%). [31]
Narrower segments:
| Category | 2024 estimate | CAGR |
|---|
| BI/analytics platforms (narrow) | $24–42B | 9–14% |
| Cloud data warehouse | $10–12B | 21–43% |
| Observability platforms (Gartner Invest, narrow) | $4–12B | 12–16% |
| APM (subsegment) | $6.5–9.3B | 11–15% |
| Incident management software | $2.5–7B | 10–12%Verified Market Research |
The data-and-analytics software universe is roughly 5–10x the size of observability/monitoring, and roughly 15–20x the narrowly-defined observability platforms market — even though both ultimately answer "how is the business doing?"
2b. Vendor revenue comparisons (most recent fiscal year)
| Vendor | FY Revenue | YoY Growth |
|---|
| Datadog (FY2024 / FY2025) | $2.68B / $3.43B | +26% / +28% |
| Splunk (FY2024 standalone, last reported) | $4.22B;StockAnalysis$4.21B Total ARRSEC.gov | +15%Business Wire |
| Dynatrace (FY2025) | $1.70B | +19%sec |
| PagerDuty (FY2025) | $467.5MWallStreetZen | +9%WallStreetZen |
| Snowflake (FY2025) | ~$3.5B total;Forge$3.46B product | ~28% |
| Databricks | $3B run-rate end FY24,Medium~$3.7B annualized mid-2025Forge | +50–57% |
| Power BI (Microsoft) | undisclosed;20M+ MAU, 200K+ customers, MSDynamicsWorld.com 97% of Fortune 500 | n/d |
Headline vendor revenues are roughly comparable, but Microsoft Power BI alone — bundled within Office 365, Fabric, and Azure — has more dashboard consumers than the entire observability industry has paying licenses combined. [32]
2c. Per-company spending data
Observability spend (New Relic 2024 Observability Forecast, n=1,700):
- Median annual observability spend: $1.95M per organization.
- Median annual value received: $8.15M → 4x ROI / 295%, doubled YoY. [33][34]
- 88% use multiple tools; 45% use ≥5 tools; mean 4.5 tools. [35]
- Median annual high-impact downtime: 77 hours; outage cost up to $1.9M/hour (rising to $2M/hour in 2025). [36][37]
- Engineers spend 30% of their time addressing disruptions. [34]
Splunk State of Observability 2024 (n=1,850):
- "Leaders" achieve 2.6x annual ROI; [38] 53% higher ROI in 2025 update.
- 86% plan to increase observability investments. [38]
- Maturity tiers: Beginning 45% / Emerging 27% / Evolving 17% / Leading 11%. [38]
Datadog customer concentration (FY2024):
- ~30,000 customers; 3,610 with $100K+ ARR; 462 with $1M+ ARR. [39]
- $100K+ customers = 88% of total ARR. [40]
- Anecdotal: OpenAI reportedly spends ~$170M/year on Datadog alone. [41]
Observability as a percentage of cloud infrastructure spend. The widely-cited 20–30% of infrastructure spend rule originated as Charity Majors' 2018 Twitter anecdote and has been disowned as imprecise but reaffirmed in order of magnitude. Matt Klein (Envoy creator, 2024) cited organizations frustrated by observability exceeding 25% of infrastructure spend. [42] OneUptime case study (2026): a 50-engineer SaaS spending 30–50% of $80K–120K/month AWS bill on monitoring; [43] 70%+ in extreme cases. [44] At AWS-scale orgs this often exceeds the BI software budget — yet typically only engineers see the data.
BI ROI evidence (for comparison):
- Forrester TEI of Microsoft Power BI: 625% comprehensive 3-year ROI / 413% TCO-level ROI; [45] $329 cost per BI user / $2,381 benefit per user. [45]
- Forrester TEI of Power BI (later 63-company study): 366% 3-year ROI; 2.5% increase in operating income; 18 → 10 month time-to-market reduction. [46]
- Forrester TEI of Dataiku: 413% ROI, $23.5M benefits. [47]
- Forrester TEI of Cloudera Public Cloud: 194% ROI, $35M benefits. [48]
2d. Who consumes the data? The defining asymmetry
BI/analytics is designed for distributed business consumption — executives, finance, marketing, sales, operations, product. BI tool adoption has nonetheless been "stuck at ~25–35% of all employees" for 15+ years (Gartner 2010, BARC 2022, Tableau founder testimony). Pervasive BI "remains elusive" per Gartner. [49][50]
Observability is designed for engineers and SREs. New Relic's 2024 respondent base: 65% practitioners, 35% IT decision-makers; business stakeholders are not surveyed because they are not the primary users. [36] Grafana, IBM, AWS, and PagerDuty all explicitly position observability as engineer-/SRE-/DevOps-targeted tooling.
"Business observability" — emerging but low penetration:
- Only 40% of organizations have deployed business observability (correlating telemetry with business outcomes); 47% plan to within 3 years (New Relic 2024). [34]
- Only 24% can correlate all or almost all data across their application environment (Splunk 2024). [51]
- 41% report telemetry data is "more siloed" than unified. [52]
- 35% of respondents have 5+ business-related data types integrated with telemetry. [52]
- Organizations with business observability had 24% lower hourly outage costs and 25% less time addressing disruptions. [34][53]
2e. Executive ownership asymmetry
- 82.6% of large organizations have a CDO/CDAO [54] (Wavestone/NewVantage 2024), up from 12% in 2012; [54] >50% of Fortune 500. [55]
- Near-zero comparable executive role for observability or reliability. SRE, DevOps, and platform leaders rarely sit at the executive committee. PagerDuty's "Chief Reliability Officer" framing has not become a recognized C-level title.
- Companies have built executive infrastructure and dedicated budget pools for BI consumption, but virtually no equivalent owner for operational signal.
- Stephen Dick, VP Infrastructure Engineering at Paylocity (CIO.com 2024): "When reliability graduates to a board-level problem, the context shifts entirely. The importance of 'error budgets' and 'latency percentiles' and 'partial service degradation' fades. Revenue loss becomes the focus… Boards don't think in terms of uptime. Their focus is on negligence, fiduciary duty, and whether the people they trusted to manage risk actually managed it." [56]
- Harvard Law School Forum on Corporate Governance (2025): 40% of CIOs rate their boards' effectiveness as poor [57] — a record high — citing the knowledge gap on digital transformation and observability. [57]
2f. The data-gravity problem
- 81% of IT leaders report data silos hindering digital transformation [58] (industry survey, recurring).
- SRE/observability data flows to Datadog, Splunk, Dynatrace, etc. BI/analytics data flows to Snowflake, Databricks, BigQuery. The two pipelines almost never share a data lake; observability platforms typically use proprietary query languages with 7–30 day default retention.
- Datadog's 2024–2025 acquisitions of Eppo (experimentation) and Metaplane (data observability) are explicit moves to bridge this gap. [59][60]
- Mordor Intelligence: only ~10% of enterprises achieve full observability; nearly half cite skills shortages. [61]
- New Relic 2024: only 25% of organizations have full-stack observability (18% retail, 35% IT).
The term "business intelligence" was coined in 1958 and popularized by Howard Dresner in 1989. The term "business observability" is new in the last 2–3 years, with 40% deployment as of 2024. Operational signal as business intelligence is roughly 35 years behind business intelligence as a discipline.
3. Healthtech-specific reliability and business stakes
This section provides industry context relevant to a healthtech Director of Technical Strategy.
3a. Cost of healthcare downtime
- Ponemon (2016): healthcare downtime $7,900–$8,851/minute; $740,357 average per facility incident (38% increase from 2010). Top cost categories: business disruption ($256K), lost revenue ($209K), end-user productivity ($138K).
- IBM (2022): healthcare data breaches average $10.10M — highest of any industry for the 12th consecutive year. [62] 232 days to detect, 85 days to contain.
- Splunk/Oxford Economics (2024): Global 2000 lose $400B/year to unplanned downtime — ~9% of profits, ~$200M per company; $9,000/minute, $540K/hour. [63] 2.5% average stock drop per incident; 79 days to recover. [64]
- ITIC 2024: 90%+ of mid/large enterprises report >$300K/hour outage cost; [65] 41% report $1M–$5M+/hour. [66]
3b. Change Healthcare attack (Feb 2024)
- Total cost to UnitedHealth Group: $2.87B for full-year 2024 (vs. original $1B–$1.6B estimate); $22M ransom paid.
- Change Healthcare processes ~15B transactions/year and ~$1.5T in claims, handling ~1 in 3 U.S. patient records.
- AHA March 2024 survey: 74% of hospitals reported direct patient care impact; 94% reported financial impact; 33% saw >50% of revenue disrupted.
- AHA CEO Rick Pollack: "The most significant and consequential incident of its kind against the U.S. healthcare system in history."
3c. CrowdStrike outage healthcare impact (July 2024)
- JAMA Network Open: 759 of 2,232 hospitals (34%) experienced detectable network disruptions. [67] 21.8% of outages were direct patient-facing services; [68] 7.8% lasted >48 hours. [69]
- Estimated $1.94 billion in direct healthcare losses [70] — most damaged sector.
3d. Reliability as a patient-safety leading indicator
- Neprash, McGlave, and Nikpay, American Economic Journal: Economic Policy (Feb 2026): Hospital volume falls 17–25% during ransomware attack week; Medicare revenue declines 19–41%; in-hospital mortality increases 34–38% for patients admitted at the time of attack. Estimated 42–67 Medicare deaths attributable to ransomware 2016–2021. [71]
- Larsen et al., JAMIA (2018): 76 of 80,381 patient-safety incidents linked to EHR downtime; 48.7% lab-related; 14.5% medication-related; [72] 46% indicated downtime procedures were not followed or did not exist. [72]
- Adjacent (non-attacked) hospitals see +74.6% stroke code activations and +113.6% confirmed strokes during nearby attacks (JAMA Network Open).
- Sepsis context: each hour of antibiotic delay increases mortality ~7.6% — reliability windows have direct mortality consequences.
3e. EHR usability, reliability, and clinician retention
- Mayo Clinic / Sinsky: EHR usability strongly correlated with physician burnout; CPOE most strongly tied to burnout. [73]30836-5/fulltext)
- HIMSS 2025: 70% of clinicians rated EHR improvements as "very" or "extremely" helpful for reducing burden; [74] 17% report no organizational action.
- Telehealth.org expert panel: "People do not abandon telehealth because it does not work. They abandon it because it does not work for them." — friction (logins, support reliability) drives provider abandonment more than feature gaps.
- Teladoc Health: stock down 61.6% in 2024, following 54% (2021) and 74% (2022) declines; analyst narrative ties part of erosion to platform trust and reliability.
3f. Cohort effects in healthtech reliability
- Change Healthcare impact varied with hospital cash reserves, vendor redundancy, and Change Healthcare reliance — i.e., reliability data sliced by hospital segment would have surfaced differential exposure pre-incident.
- Ransomware effects disproportionately fall on Black patients, rural and critical-access hospitals, and Medicaid-leaning populations (Neprash et al.).
- ~80% of U.S. rural areas are medically underserved and most reliant on telehealth reliability with least redundancy.
3g. Healthtech-relevant regulatory framing
- HIPAA Security Rule 45 CFR § 164.312(b) requires audit controls and explicitly mandates availability of ePHI alongside confidentiality and integrity; logs retained 6 years.
- FDA's 2021 AI/ML Action Plan and 2023 Predetermined Change Control Plan guidance use a "Total Product Lifecycle" approach, expecting continuous postmarket vulnerability monitoring with SBOMs and clinical-impact determinations.
- GAO (2024): 1.7M+ injuries and 83,000 deaths over 10 years potentially linked to medical devices; postmarket surveillance system mandated 2012 still being built out.
3h. Mobile-app retention in healthtech (segment-level reliability stake)
- Apptentive: medical apps have 34% 90-day retention (vs. 48% macro) and 16% annual retention (vs. 35%).
- Cross-study median mHealth retention: 5.5 days (range 2–26 days, n>100,000).
- Stanford MyHeart Counts mean engagement: 4.1 days.
- Reliability and UX issues are the dominant churn drivers in healthtech mobile apps.
4. Synthesis: the strategic argument supported by this evidence
The research supports five interlocking propositions that a Director of Technical Strategy at a healthtech company can defend:
- Reliability data is empirically a leading indicator of revenue. Two decades of A/B-tested findings (Amazon, Bing, Google, Walmart, Pinterest, Vodafone, Renault, Deloitte) show measurable, persistent revenue and conversion effects from latency and reliability changes well below the threshold of business-dashboard visibility.
- The most valuable signal lives in customer-cohort slices of reliability data, not in aggregate uptime. Pinterest's mobile-vs-desktop conversion gap, Capital One's customer-journey graphs, Honeycomb's high-cardinality model, and the Change Healthcare hospital-cohort impact data all point to per-segment reliability as the actionable layer.
- Spending is asymmetric in the wrong direction. The data-and-analytics universe ($175B Gartner 2024) is 15–20x the narrowly-defined observability platforms market — yet observability itself routinely consumes 20–30% of cloud infrastructure spend. Companies under-invest in consuming operational data even as they over-invest in producing it.
- Consumption is asymmetric. BI is designed for whole-company use (still only 25–35% adoption); observability is designed for engineers (3,000-user-typical scope). Only 40% of organizations have deployed business observability; only 24% can correlate all data across the application environment. 82.6% of large orgs have a CDO/CDAO; near-zero have an executive owner for observability.
- In healthtech specifically, the strategic stakes include patient mortality, regulatory exposure, and clinician retention — not only revenue. The Neprash et al. ransomware study, the Larsen JAMIA EHR study, the Change Healthcare $2.87B fallout, and the CrowdStrike $1.94B healthcare-sector loss all show that operational signal is, in healthcare, simultaneously a clinical, regulatory, and financial leading indicator that engineering teams routinely see first and alone.
The central tension this evidence frames: companies have spent 35 years building executive infrastructure for business intelligence while leaving operational intelligence — often the larger and earlier signal — locked in engineering dashboards under the ownership of teams that do not sit at the strategy table.
5. Caveats and source-quality notes
- The Amazon "100ms = 1%" stat is directional, not peer-reviewed (Linden 2006 blog).
- The Akamai/Forrester 2009 stats are stated-preference survey data.
- Forrester TEI studies (Elastic, Cisco, New Relic, Microsoft Power BI, Dataiku, etc.) are vendor-commissioned with small composite organizations — best-case scenarios; the cross-study pattern is what's reliable.
- Market sizing varies 3–10x between research firms because of definitional differences (e.g., "observability" $2.9B Mordor vs. $28.5B Research Nester). Gartner is most authoritative for the data-and-analytics umbrella.
- The "20–30% of infra spend on observability" rule originated as a Honeycomb/Twitter anecdote; Charity Majors has publicly disowned its precision while reaffirming the order of magnitude.
- DORA / Accelerate is the strongest empirical anchor — 10+ years, n>39,000, peer-reviewed methodology (Accelerate, Forsgren/Humble/Kim, 2018, Shingo Award).
- The Neprash ransomware mortality study (34–38% mortality increase) was a working paper as recently as 2023; published peer-reviewed in AEJ:EP February 2026.
- The Gartner "$5,600/minute" downtime stat is from 2014 and frequently misapplied without industry/size context.
- CrowdStrike disputed the JAMA UCSD outage methodology; it remains the first large-scale healthcare-impact measurement of that event.
- Some EHR-downtime studies (Becker's-cited) found no 30-day mortality effect for surgical inpatients — clinical impact varies by acuity, attack severity, and downtime length.
- "Observability 2.0" is contested terminology (Hazel Weakly's "Observability 3.0" rejoinder); the underlying technical claim about wide events is widely accepted.
- Google — https://sre.google/sre-book/service-best-practices/
- IR — https://www.ir.com/guides/observability/metrics-vs-logs-vs-traces-signals-explained/
- Google Cloud — https://cloud.google.com/blog/products/gcp/understanding-error-budget-overspend-cre-life-lessons
- Charity — https://charity.wtf/2022/08/15/live-your-best-life-with-structured-events/
- Heavybit — https://www.heavybit.com/library/podcasts/o11ycast/ep-6-customer-reliability-engineering-with-googles-liz-fong-jones
- The Pragmatic Engineer — https://newsletter.pragmaticengineer.com/p/observability-the-present-and-future
- LinkedIn — https://www.linkedin.com/posts/efong_kafka-activity-6871530022880980992-aJCF
- USENIX — https://www.usenix.org/sites/default/files/conference/protected-files/srecon18emea_slides_fong-jones1.pdf
- LinkedIn — https://www.linkedin.com/posts/efong_liz-fong-jones-%E6%96%B9%E7%A6%AE%E7%9C%9F-on-twitter-activity-6887977608093548544-XSFv
- Se-radio — https://se-radio.net/2023/01/episode-548-alex-hidalgo-on-implementing-service-level-objectives/
- DORA — https://dora.dev/guides/dora-metrics/
- IT Revolution — https://itrevolution.com/wp-content/uploads/2022/06/The-Key-to-High-Performance.pdf
- Octopus Deploy — https://octopus.com/devops/metrics/dora-metrics/
- ScienceLogic — https://sciencelogic.com/blog/gartner-io-and-cloud-strategies-conference-2025-from-observability-to-outcome-driven-operations
- Conductor — https://www.conductor.com/academy/page-speed-resources/faq/amazon-page-speed-study/
- Container Solutions — https://blog.container-solutions.com/charity-majors-on-code-rewrites-observability-and-team-performance
- Honeycomb — https://www.honeycomb.io/resources/reports/the-business-value-of-the-honeycomb-observability-platform-idc-report
- Tigren — https://www.tigren.com/blog/pinterest-pwa/
- Hobo-Web — https://www.hobo-web.co.uk/your-website-design-should-load-in-4-seconds/
- Medium — https://medium.com/pinterest-engineering/driving-user-growth-with-performance-improvements-cfc50dafadd7
- Medium — https://medium.com/dev-channel/a-pinterest-progressive-web-app-performance-case-study-3bd6ed2e6154
- Honeycomb — https://www.honeycomb.io/resources/birdie-case-study-video
- Google — https://sre.google/workbook/slo-engineering-case-studies/
- Medium — https://medium.com/capital-one-tech/observability-with-automated-customer-journey-graphs-e40c79be05f1
- Elastic — https://www.elastic.co/explore/devops-observability/forrester-total-economic-impact-observability
- Forrester — https://tei.forrester.com/go/elastic/observability/
- Splunk — https://www.splunk.com/en_us/form/forrester-total-economic-impact-of-cisco-full-stack-observability.html
- Forrester — https://tei.forrester.com/go/NewRelic/ObservabilityPlatform/?lang=en-us
- Chronosphere — https://chronosphere.io/learn/independent-analyst-study-shows-chronosphere-delivers-165-roi/
- Totaleconomicimpact — https://tools.totaleconomicimpact.com/go/Dynatrace/dTEI/docs/TEI_of_Dynatrace.pdf
- Gartner — https://www.gartner.com/en/documents/6504971
- Electro IQ — https://electroiq.com/stats/power-bi-statistics/
- New Relic — https://newrelic.com/press-release/20241022
- Pulse 2.0 — https://pulse2.com/new-relic-study-shows-it-outages-can-cost-businesses-up-to-1-9-million-per-hour/
- New Relic — https://newrelic.com/resources/report/observability-forecast/2024/state-of-observability/current-deployment
- Business Wire — https://www.businesswire.com/news/home/20241022515206/en/New-Relic-Study-Reveals-IT-Outages-Cost-Businesses-Up-to-%241.9-M-Per-Hour
- New Relic — https://newrelic.com/resources/report/observability-forecast/2025
- Splunk — https://www.splunk.com/en_us/newsroom/press-releases/2024/splunk-report-observability-leaders-achieve-increased-developer-productivity-and-speed-boosting-their-competitive-edge.html
- Datadog — https://investors.datadoghq.com/news-releases/news-release-details/datadog-announces-fourth-quarter-and-fiscal-year-2024-financial/
- Data Insights Market — https://www.datainsightsmarket.com/companies/DDOG
- ClickHouse — https://clickhouse.com/resources/engineering/observability-tco-cost-reduction
- Matt Klein — https://mattklein123.dev/2024/04/03/observability-cost-crisis/
- OneUptime — https://oneuptime.com/blog/post/2026-03-11-the-monitoring-tax-how-observability-vendors-take-5-percent-of-cloud-spend/view
- OneUptime — https://oneuptime.com/blog/post/2026-03-10-observability-tax-monitoring-costs-vs-cloud-spend/view
- Slideshare — https://www.slideshare.net/slideshow/power-bi-tei-by-forrester/94145036
- Microsoft — https://info.microsoft.com/ww-landing-TEI-of-microsoft-power-BI.html?LCID=EN-US
- Dataiku — https://pages.dataiku.com/dataiku-forrester-tei-report
- Cloudera — https://www.cloudera.com/campaign/forrester-tei-report-the-total-economic-impact-of-cloudera-data-platform-public-cloud.html?internal_keyplay=Hybrid&internal_campaign=FY22-Q4_CC_Globl_ForresterTEI_CY_2021-12-17&cid=7012H000001eD7UQAU&internal_link=Cmnty-p12
- Gartner — https://www.gartner.com/en/documents/3753469
- TechTarget — https://www.techtarget.com/searchbusinessanalytics/news/365530077/BI-adoption-poised-to-break-through-barrier-finally
- ITPro Today — https://www.itprotoday.com/it-management/state-of-observability-2024-embracing-opentelemetry-for-better-insights
- New Relic — https://newrelic.com/resources/report/state-of-observability-for-financial-services-and-insurance-2024
- New Relic — https://newrelic.com/blog/nerdlog/insights-2024-observability-forecast
- Squarespace — https://static1.squarespace.com/static/62adf3ca029a6808a6c5be30/t/66635b1a6aeebf254874237b/1717787418584/DataAI-ExecutiveLeadershipSurveyFinalAsset.pdf
- Raconteur — https://www.raconteur.net/c-suite/the-rise-of-the-chief-data-officer
- CIO — https://www.cio.com/article/4149405/what-actually-changes-when-reliability-becomes-a-board-level-problem.html
- Harvard Law School Forum on Corporate Governance — https://corpgov.law.harvard.edu/2025/06/23/board-effectiveness-a-survey-of-the-c-suite-4/
- Fivetran — https://www.fivetran.com/learn/breaking-down-data-silos
- Mordor Intelligence — https://www.mordorintelligence.com/industry-reports/observability-market
- Market.us — https://market.us/report/observability-market/
- Mordor Intelligence — https://www.mordorintelligence.com/industry-reports/log-management-market
- IBM — https://www.ibm.com/think/x-force/healthcare-data-breaches-costliest
- Splunk — https://www.splunk.com/en_us/blog/cio-office/cost-of-downtime-from-global-executives.html
- Tech Monitor — https://www.techmonitor.ai/technology/cybersecurity/unplanned-downtime-costing-global-2000-400-billion-annually-survey-finds
- Itic-corp — https://itic-corp.com/category/itic-reports-surveys/
- E-N Computers — https://www.encomputers.com/2024/03/small-business-cost-of-downtime/
- PubMed Central — https://pmc.ncbi.nlm.nih.gov/articles/PMC12276631/
- PubMed — https://pubmed.ncbi.nlm.nih.gov/40682764/
- Fierce Healthcare — https://www.fiercehealthcare.com/health-tech/crowdstrike-it-outage-disrupted-digital-services-hundreds-hospitals-study-estimates
- PubMed Central — https://pmc.ncbi.nlm.nih.gov/articles/PMC12404578/
- Statnews — https://www.statnews.com/2023/11/17/hospital-ransomware-attack-patient-deaths-study/
- PubMed Central — https://pmc.ncbi.nlm.nih.gov/articles/PMC7647128/
- Mayo Clinic Proceedings — https://www.mayoclinicproceedings.org/article/S0025-6196(19
- Healthsystemcio — https://healthsystemcio.com/2025/04/22/clinicians-feeling-burnout-but-ehr-improvements-have-significant-mitigating-effect-himss-report-finds/
Commissioned from our research desk. Subject to final editorial discretion.
The strategic cost of treating observability and reliability as engineering-owned concerns rather than business intelligence. Cover how SLOs, error budgets, and incident patterns contain signal about product-market fit, customer segment health, and operational scalability that never reaches decision-makers because it's trapped in dashboards only engineers read. Research the gap between what companies spend on business analytics versus operational analytics. The takeaway is that a Director of Technical Strategy should be translating system behavior into business foresight, not just uptime reports.