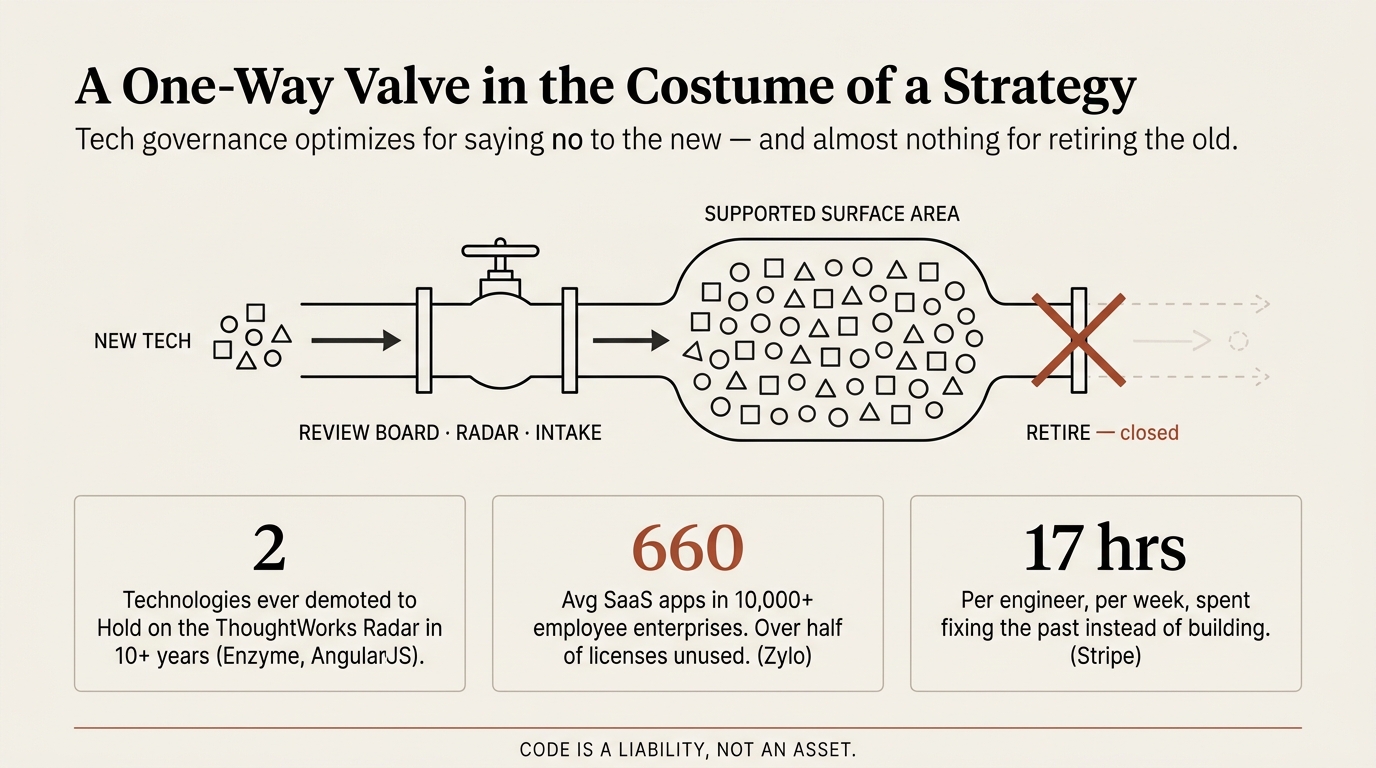
The uncomfortable reality that most technology radar and tech adoption governance processes optimize for saying no to new things while doing almost nothing to force retirement of old things
BY STAVROS · APRIL 26, 2026
The proof is indisputable.
THE INSIGHT
I spent time this week looking at our technology governance, and a pattern kept presenting itself. We have an architecture review board, a tech radar, intake forms, exception processes, all pointed at the same question: should we let this new thing in. Almost nothing in our process is pointed at the opposite: what we ought to throw out.
This pattern shows up everywhere in the industry.
Consider the ThoughtWorks Technology Radar, run by 22 senior technologists for over a decade. In that stretch, only two technologies, Enzyme and AngularJS, were ever demoted from a positive ring into Hold. Neal Ford, who helps run it, has said publicly that they are too afraid to put things in Hold. The people who invented the format struggle to retire things from their own list.
Then look at what accumulates inside large organizations. JetBrains found 44% of development organizations use more than ten programming languages. Zylo puts the average 10,000+ employee enterprise at 660 SaaS applications, with more than half of licenses unused. Black Duck's audit of nearly a thousand commercial codebases found 90% contain open source components more than four years out of date. Veracode reports half of organizations carry critical security flaws older than a year, with average fix time stretching from 171 to 252 days.
This is what one-way governance produces. Every approval is permanent, while every rejection is temporary, because the thing you blocked shows up next quarter under a different name, in a different team's stack, on a corporate card someone expensed.
We pay in quiet, daily ways. Stripe estimated 17 hours a week per engineer spent fixing the past rather than building the future. McKinsey put technical debt at 20 to 40% of the value of the entire technology estate. The GAO reports around 80% of the federal government's hundred-billion-dollar annual IT spend goes to operating and maintaining what already exists. Hyrum Wright, in Software Engineering at Google, has the line I keep coming back to. Code is a liability, not an asset.
If that is correct, most of our governance energy is pointed the wrong way. Reviewing new things is the easy half. The harder half, the one almost no committee is structured to do, involves choosing what to remove, naming an owner, funding the work, and giving credit when the architecture diagram gets simpler.
A governance process that can only add to the surface area is, by construction, a process for accumulating risk. A radar with an Adopt ring and no Retire ring is a one-way valve in the costume of a strategy.
The question I am putting to my own team this quarter is the boring one. What did we kill? If the answer is nothing, we did not govern this quarter. We curated a growing museum, and someone after us will have to pay the admission.
THE EVIDENCE
The retirement deficit in tech governance: a research dossier
Purpose: Source material for a LinkedIn post on the asymmetry between approving new technologies and retiring old ones. This is research only — not a draft post. Statistics include source, date, sample size, and bias notes where applicable. Vendor-funded reports are flagged.
1. Governance asymmetry: how radars and ARBs actually work
The ThoughtWorks Technology Radar — the canonical artifact
Created by Rebecca Parsons during her tenure as ThoughtWorks CTO, the Radar is produced by the firm's Technology Advisory Board (TAB) — currently 22 senior technologists, meeting twice yearly in person and biweekly virtually, advising current CTO Rachel Laycock. [1] Published twice a year (Vol 33 = November 2025; Vol 32 = April 2025). Four quadrants (Techniques, Tools, Platforms, Languages & Frameworks) × four rings (Adopt, Trial, Assess, Hold). [2] [thoughtworks.com/radar; FAQ page]
The "Hold" ring is the closest thing the radar has to a retirement signal — and ThoughtWorks itself admits it's barely used. From Neal Ford's "Build Your Own Technology Radar" essay: "The hold ring has evolved into our way of saying 'don't start anything new with this technology.' There's no harm in using it on existing projects… Thoughtworks Hold is the closest we have to an avoid category, which Rebecca won't let us have." [3] Ford has stated publicly: "In my opinion, we are way too afraid to put things in Hold at Thoughtworks and in Adopt. I think we've gotten way too conservative." [4]
ThoughtWorks's stated philosophical reason for resisting an explicit "Avoid" ring: "true to the metaphor, your radar should be about things you are looking towards, not recriminations about the past." [3]
The single most striking empirical asymmetry, from ThoughtWorks's own "Radar in numbers" 10-year retrospective (thoughtworks.com/radar/faq/10-years-of-radar/radar-in-numbers):
- 32 blips that started in Assess eventually moved into Adopt [5]
- Only ONE blip ever made it to Adopt before being demoted to Hold: Enzyme [5]
- Only ONE blip ever started in Trial before ending up in Hold: AngularJS [5]
In effect, in over a decade of curation by a 22-person senior technologist board, only two technologies were demoted from a positive recommendation ring into Hold. This is the cleanest available evidence of the "ratchet" pattern.
In Vol 33 (Nov 2025), ThoughtWorks rebranded the outer ring as "Caution": "The industry should consider alternative options or even proactively avoid these things. We've had negative experiences that have impacted our work." [6][7] The change is recent and worth noting.
Architecture Review Boards (ARBs)
Standard scope (per LeanIX, Open Group TOGAF): approve/reject architectural designs; set/enforce standards; ensure cross-domain consistency. [8] TOGAF lists 20+ ARB responsibilities [9] — virtually all directed at new design and approval flow.
Critiques converge on a "gatekeeping bottleneck" pattern:
- Bo Vincent Thomsen (LinkedIn essay "No more Architecture Review Boards, please?"): "It hinders autonomy and centralises knowledge and decisions… ARB hinders flow. Up-front board approval becomes a bottleneck to achieving value flow for the business." [10]
- Gregor Hohpe, 37 Things One Architect Knows (2017), defends governance but is explicit retirement is part of the duty: "Strategy also includes 'retiring' systems (in the Blade Runner sense of the word) lest you want to live among Zombies." [11] His seminal "Architecture is selling options" framing (Architect Elevator, Oct 2016) reframes the value of architects as preserving optionality, not generating approvals.
- Will Larson, Staff Engineer (2021) and Crafting Engineering Strategy (2025), recommends architecture review as a forum, not a gate, and now treats system migrations and API deprecations as a strategy concern in their own right — implicitly recognizing the retirement gap.
- Camille Fournier, The Manager's Path (2017), addresses architecture review under "Developing Engineering Processes" [12] and emphasizes "depersonalize decision making" [12] — implying the social/political baggage is the primary failure mode, not the absence of retirement mandates.
The phrase "every yes is a future no" has no clean primary attribution in any of these authors' work. The closest analogue is James Clear's aphorism "Saying no saves you time in the future. Saying yes costs you time in the future. No is a form of time credit. Yes is a form of time debt." Treat as a community-level idea, not a citation-bearing claim.
Notable: companies that have added retirement rings
- REA Group extended their internal radar to 5 rings: Adopt, Consult, Experiment, Hold, Retire [13] — featured on ThoughtWorks's own "How to create your enterprise technology radar" page.
- Zalando's public radar (opensource.zalando.com/tech-radar, since 2016) explicitly tasks engineering heads with "divesting from non-promising technologies and removing failed experiments from the Zalando technology landscape." [14]
- Audacia and others rename "Hold" to "Avoid" for an explicit retirement signal.
2. The sprawl: how many technologies actually run inside a typical enterprise
Programming languages
- JetBrains State of Developer Ecosystem 2024 (n=23,262 developers, 171 countries; vendor-funded, weighted): 44% of software development organizations used more than 10 programming languages in 2024. Companies with under 5,000 employees most commonly used 4–9 languages. [15]
- Stack Overflow Developer Survey 2024 (n=65,437 across 185 countries): JavaScript 62%, HTML/CSS 53%, Python 51%. [16] "Those learning to code indicated they want to use an average of 12 different languages next year." [16]
- GitHub Octoverse 2025: TypeScript surpassed Python as #1 in August 2025; [17][15] Java and C# each added 100k+ contributors in 2025 [17] — "Enterprise stacks endure." [17] 180M+ developers; [17] 420M+ repos; 230 new repos/minute. [17]
- GitHub Octoverse 2024: Python overtook JavaScript [18][19] for the first time in a decade. [20]
- No clean Fortune-500-specific language-count statistic is publicly published; JetBrains' "44% use >10 languages" is the best proxy.
Databases / data stores
- DZone 2019 (most-cited canonical stat, methodology limited): within a single organization, 3.1 different databases were used for their applications. [21] Per-application figure.
- Older academic reference (Sadalage/Fowler-era polyglot persistence literature, pre-2017): an average Fortune 1000 company has ~48 applications and 14 databases for a total of 62 potential systems to integrate. [22]
- JetBrains 2024: "Database popularity has remained fairly stable… It seems that the main databases driving business are well-established, with very few organizations switching from the databases they've adopted." [23] — accumulation, not replacement.
- Stack Overflow 2024: PostgreSQL 49% (up from 33% in 2018, when MySQL led at 59%); [24] Redis usage +8 pp YoY in 2025. [25]
- No recent (2022+) publicly available survey quantifies the average distinct-database-systems-in-production count at large enterprises. Vendor reports (ScyllaDB, MongoDB, Redis, Percona) focus on workload size, not stack diversity.
SaaS applications per enterprise (huge methodology divergence — read carefully)
| Source | Avg SaaS apps | Year | Method | Bias |
|---|
| Okta Businesses at Work 2025 | 101 (global avg, +9% YoY); 131 for 5,000+ employees | 2024 data | Telemetry from 18,800+ Okta customersOkta | Counts only SSO-integrated apps; undercounts shadow IT |
| BetterCloud State of SaaSOps 2024 | 106 (peaked at 130 in 2022; -14% in 2023, -5% in 2024) | 2024 | Survey of 743 IT/security pros | Vendor (SMP); first multi-year decline ever recorded |
| Vendr SaaS Trends | ~130 (older figure) | 2022 | $2.3B+ processed deals | Vendor (procurement) |
| Zylo SaaS Management Index 2025 | 275 average; 152 for 1–500 employees; 660 for 10,000+ employees | 2024 data | Proprietary SMP platform; 40M+ licenses, $40B spend trackedZylo | Vendor; enterprise-heavy customer base |
| Productiv State of SaaS 2024 | 342 (down from 374 in 2023; enterprise segment 473) | 2024 | "Hundreds of active instances" via SSO + expense + contract data | Vendor; tech-sector skew |
The often-cited "1,000+ SaaS apps per enterprise" stat is not corroborated in any primary vendor report. The highest verified figure is Zylo's 660 apps for 10,000+-employee organizations Zylo (2024 data).
Cross-cutting waste numbers:
- Productiv 2024: 48% of enterprise apps are unmanaged [26] ("shadow IT"); [26] average user-engagement across all apps is only 45% [27][26] (i.e., over half of paid licenses unused).
- Zylo 2025: 52.7% of purchased SaaS licenses go unused; [28] $21M wasted spending per organization annually on average. [28] Avg 7.6 apps enter environment per month — would yield 33% portfolio growth if unmanaged. [29] Top redundancy: avg company has 15 duplicative online training apps, 11 PM tools, 10 team collaboration apps. [30]
- Gartner forecast: "75% of employees are expected to acquire, modify, or create technology without IT's oversight by 2027" (up from 41% in 2022); [31] 30–40% of IT spending in large organizations is shadow IT. [31]
- Gartner (2022, via Computerworld): "Knowledge workers, on average now use about 11 applications compared to just six in 2019. Forty percent of digital workers are using more than the average number of applications and 5% use 26 or more." [32]
- DX Developer Experience Survey 2025 (Abi Noda): "Developers switch between an average of 9.4 different tools per day." [33]
- Productiv 2021: Engineering departments avg 77 apps; Security 78; [34] IT 61. [27]
Microservices
- Kong/Vanson Bourne 2020 (n=200 IT leaders at 1,000+-employee firms; vendor-funded, small sample): average 184 microservices per organization; 60% running 50+. [35]
- Statista/IDG 2021 (n=950): 85% of orgs with 5,000+ employees use microservices. [36]
- Gartner Peer Community survey: "Almost half of leaders' organizations that are using [microservices] manage fewer than 100 microservices"; [37] 45% describe their count as "suboptimal but satisfactory." [37]
3. The bill: technical debt and legacy maintenance burden
Stripe Developer Coefficient (Sept 2018)
The most-cited single statistic on engineer time spent on tech debt. Average developer workweek = 41.1 hours, [38] of which:
- 13.5 hours/week on technical debt [38][39]
- 3.8 hours/week on bad code (debugging, refactoring poor-quality code) [38]
- Combined: 17.3 hrs/week — ~42% of the workweek "fixing the past rather than building the future." [38][39]
- "Bad code" estimated at $85 billion in global GDP loss annually; [40] total software-engineering inefficiency could cost $3 trillion in global GDP over the next decade. [41]
Caveat: 7+ years old, single self-reported survey; Stripe has not refreshed it. Sample size not granularly disclosed.
McKinsey on technical debt
- "Tech debt: Reclaiming tech equity" (Oct 2020, n=50 CIOs of FS/tech firms with >$1B revenue): "CIOs estimated that tech debt amounts to 20 to 40 percent of the value of their entire technology estate before depreciation… 10 to 20 percent of the technology budget dedicated to new products is diverted to resolving issues related to tech debt." [42] 60% of CIOs felt tech debt had risen perceptibly over the past three years. [42] Quote from a leading cloud provider's CIO: "By reinventing our debt management, we went from 75 percent of engineer time paying the [tech debt] 'tax' to 25 percent." [42]
- "Breaking technical debt's vicious cycle": 30% of CIOs surveyed believe more than 20% of technical budget is diverted to tech debt. [43] Companies in the bottom 20th percentile of tech-debt severity are 40% more likely to have incomplete or canceled IT modernizations. [43] One bank case study: 1,000+ systems generating >$2 billion in tech-debt costs. [44]
- "Demystifying digital dark matter" (TDS analysis, n=220 organizations): "Almost half of firms that completed modernization programs were unsuccessful in reducing technology debt." [44] One insurer: tech debt = 15–60% of every dollar spent on IT. [44]
Protiviti Global Technology Executive Survey (March 2023, n=1,050 senior tech execs, majority $1B+ revenue)
- Average 30% of IT budget and 20% of resources spent managing technical debt. [45]
- 70% of organizations view technical debt as having a high impact on innovation. [46]
- By industry, "high impact" reported by biotech/medical devices 82%, telecoms 81%, financial services 78%, healthcare provider services 66%. [45]
- Transportation/logistics organizations spend 39% of IT budget servicing technical debt. [45]
- Only 6% of technology organizations have a process to track/report technical debt. [45]
- GAO 2021/2023: Of the U.S. federal government's >$100 billion annual IT spend, [47] roughly 80% goes to operating and maintaining existing systems. [48][49]
- Gartner G00308477 ("Run, Grow and Transform" framework): notes typical 66% transform-project failure rate; [50] healthy portfolios cited as 30–50% Run / 30–50% Grow / 10–25% Transform. [51] No fresh single Gartner press number on the run-share for 2024–2026 was located; the GAO 80% figure is the cleanest contemporary benchmark.
U.S. GAO reports on legacy systems (most authoritative empirical source)
- GAO-25-107795 (April 2025): ~80% of >$100B annual federal IT spend on O&M of existing systems. [52] 11 most critical legacy systems identified across 10 agencies. [53] 8 of 11 use outdated languages; 4 have unsupported hardware/software; 7 operate with known cybersecurity vulnerabilities. Three of these systems were also flagged in 2019 — six years later, still un-modernized.
- GAO-19-471 (June 2019): 10 most critical federal legacy systems ranged 8–51 years old; combined ~$337M/year O&M cost. [47][49] DoD using 8-inch floppy disks to coordinate nuclear forces [54] (in service until 2019); Treasury using assembly language; [54] IRS Individual Master File (IMF) >60 years old in COBOL/Assembler, [55] 25–64-year-old applications, software up to 15 versions behind. [56]
- GAO-25-107611 (2025): IRS modernization paused; [57] 2030 IMF replacement now indefinite. [58]
UK government / NHS specifics
- UK National Audit Office "Government cyber resilience" (Jan 2025): At least 228 legacy IT systems in central government; 28% (63) red-rated for high operational/security risk; [59] 53% (120) had no fully funded remediation plan. [60] One in three central-government cyber roles vacant or temp-staffed; [61] in some departments >50% unfilled. 70% of specialist security architects in post were temps, [62] costing 2× salaried civil servants. [59] Gareth Davies (NAO chief): "The government will continue to find it difficult to catch up until it successfully addresses the longstanding shortage of cyber skills, strengthens accountability for cyber risk, and better manages the risks posed by legacy IT."
- DSIT/Bain "State of Digital Government Review" (Jan 2025): Average 28% of central government systems are legacy (up from 26% in 2023). [63] NHS trusts 10–50% legacy; police forces 10–70% legacy. Data Center Dynamics 15% of NHS trusts couldn't even estimate the size of their legacy estate. Legacy maintenance "often three to four times that of modern alternatives." [63] Estimated £45 billion in lost productivity savings due to outdated technology; central government spends ~£2.3bn/year (~50% of central IT budget) on legacy. [64][65]
- NHS: WannaCry 2017 cost £92M direct + ~£275M follow-on cyber investment; [66] 34% of NHS trusts disrupted; ~19,000 appointments cancelled. [67] As late as 2018, 2,300 NHS computers still on Windows XP. [68] NHS England 2024 reported 123 major system failures. [69] June 2024 Synnovis (pathology) cyber attack postponed 10,152 acute outpatient appointments and 1,710 elective procedures in southeast London. [61]
- HTN Trust regional research (2026): 52% of NHS organisations say legacy systems significantly limit modernisation; only 12% consider themselves cyber resilient. [70]
OutSystems & vendor research
- OutSystems 2025 State of Application Development (n=~1,700): "73% of organizations consider legacy modernization significant or central to their app development strategies." [71] (Vendor: low-code platform.)
4. Security exposure from old, forgotten, and EOL dependencies
Open-source dependency and vulnerability landscape
- Black Duck (formerly Synopsys) OSSRA 2025 (10th edition, 1,658 audits / 965 codebases / 16 industries, 2024 data): 97% of audited codebases contain open-source components; [72] 86% contain at least one OSS vulnerability; 81% contain high- or critical-risk vulnerabilities; [73] 90% have components more than four years out-of-date; [73] 64% of OSS components are transitive. [72] Average application: 911 OSS components; [74] OSS file count tripled from 5,386 (2020) to 16,082 (2024). [74] jQuery present in 43% of applications; CVE-2020-11023 (jQuery XSS) is the single most-frequent high-risk vulnerability. [75]
- Synopsys OSSRA 2024 (1,000+ audits, 2023 data): Coined the "zombie code apocalypse": 91% of codebases contained components ≥10 versions out-of-date; 49% had components with no development activity in past 2 years; [76] mean age of OSS vulnerabilities ≈2.5 years; 14% had vulnerabilities >10 years old. [76]
- Sonatype State of the Software Supply Chain 2024 (data from 7M+ OSS projects, 1.5T Maven downloads): 80% of application dependencies remain un-upgraded for over a year, despite >99% of packages having updated versions available. [77] 95% of the time, when vulnerable components are consumed, a fixed version already exists. [78][77] 156% YoY increase in malicious packages. [78][79] Mean time-to-remediate has grown from <25 days (2017) to >250 days for some severities by 2023–24. [80]
- Veracode State of Software Security 2025 (15th annual, n>1M apps): 50% of organizations now carry critical security debt (high-severity flaws unfixed >1 year); [81] 70% of that critical debt stems from third-party code/supply chain. Average flaw fix time rose from 171 days to 252 days over five years — up 327% over 15 years. [81] Public-sector apps: 59% carry security debt (vs 42% overall). [82]
- Snyk State of Open Source Security 2024: 45% of organizations had to replace vulnerable build components; [83] security tool adoption fell 11.3% YoY; security-training investment fell 17.8% YoY; [84] only 50% had pipeline security; [83] only 49% have a security policy explicitly addressing OSS packages. [85]
Log4Shell aftermath (the canonical "we don't retire" story)
- Original disclosure CVE-2021-44228 (Dec 2021), CVSS 10.0, fix released same day.
- Veracode (Dec 2023, n=38,278 apps / 3,866 orgs): 38% of applications still running vulnerable Log4j versions; [86] 32% of those on Log4j2 1.2.x — EOL since August 2015, with seven known high/critical CVEs. [87]
- Contrast Security (Dec 2024): "12% of Java applications are still running vulnerable versions of [Log4j]… three years after Log4Shell was discovered." [88]
- Sonatype (July 2024): 13% of all Log4j downloads were still vulnerable versions. [88]
- DHS Cyber Safety Review Board (2022): estimated full remediation of Log4Shell would take at least a decade. [86]
- Tenable (Nov 2022): 29% of assets still vulnerable to Log4Shell were "recurrences" — patched, then reintroduced. [89]
CISA Known Exploited Vulnerabilities (KEV) catalog
- End-2025: 1,484 entries; 245 added in 2025 (+20% YoY). [90] Cyble: in 2025 CISA added 94 vulnerabilities from 2024 and earlier — a ~45% increase over the 65/year average in 2023–24. [90]
- Oldest entry: CVE-2002-0367 (Windows NT/2000 smss.exe, used by ransomware groups today); [90] 2025's oldest add was CVE-2007-0671 [91] (Excel RCE).
Java-version sprawl in production
- New Relic 2024 State of the Java Ecosystem (telemetry from 62M JVM instances / ~500K production apps): Less than 30% of applications still on Java 8 [92] (down from ~46% in 2022 [93] and ~33% in 2023); Java 8 first GA was March 2014, public updates ended 2019. Log4j is in 76% New Relic of Java applications reporting to New Relic.
- Morphisec 2024: ~10% of all servers in use today still run on out-of-support Windows OSes (2008/2008 R2/2012/2012 R2).
Notable incidents that anchor the thesis
- Equifax 2017 (Apache Struts CVE-2017-5638, patch available 2 months prior): 147–147.9M Americans + 15.2M UK + ~19,000 Canadians affected; $1.38B in settlements.
- British Airways 2018 (Magecart skimmer via Modernizr; legacy Citrix without MFA; payment-card logging in plaintext since Dec 2015): 380,000–430,000 cards skimmed in 15 days; ICO fine £20M (from initial £183M proposal).
- Change Healthcare 2024 (legacy Citrix portal from Optum 2022 acquisition with no MFA, unpatched 2013-era servers, no segmentation): 190M Americans affected — the largest healthcare breach in US history; ~$872M+ in damages by UnitedHealth's own estimates. Single most current healthcare-relevant illustration of the "we adopt but never retire" failure mode.
5. The hiring and cognitive-load tax of sprawl
Niche/legacy skills
- COBOL workforce: ~220 billion lines of COBOL still in production (Reuters 2017); Micro Focus survey (n=1,104, 49 countries; vendor) puts the number above 800B lines. 92 of world's top 100 banks, 70% of Fortune 500 still rely on IBM mainframe systems. US Social Security Administration: ~60M lines of COBOL. Andrew Starrs (Accenture, AFCEA): "It's not so much that an individual may have retired, he may have expired."
- COVID-era state systems: New Jersey, Connecticut, Kansas, Wisconsin, Vermont, Iowa publicly sought COBOL programmers for unemployment systems. NJ Governor Phil Murphy: "Literally, we have systems that are 40-plus-years-old… how did we get here where we literally needed COBOL programmers?" (NPR, April 2020).
- Salary premium (USA, 2024–2026): ZipRecruiter: COBOL programmer avg $121,161/year (90th pct $186K); Glassdoor median $105,859; Salary.com $81,532. UK contrast: DWP advertises COBOL engineer at £35–55k. DWP runs ~1B lines of code in 12,000+ repos and 90+ languages, migrating from VME mainframes to Oracle (10.7B rows of citizen data).
- Migration cost: Commonwealth Bank of Australia: 5 years and A$749.9M to replace its core COBOL platform.
Frustration and cognitive-load data
- Stack Overflow 2024 Survey (n=65,000+): "Technical debt is the #1 frustration: 62.4% of professional developers — twice as much as the second- and third-most frustrating problems." #2: complex tech stacks for building (32.9%); #3: complex tech stacks for deployment (32.3%). Only ~20% of professional developers reported being "happy" at work.
- Microsoft "Engineering Thrive" / DevEx in Action (ACM Queue, Jan 2024; n=32,000+ across 177 countries): Developers with dedicated deep-work time felt 50% more productive than those without.
- DevEx framework (Noda/Storey/Forsgren/Greiler, ACM Queue 2023): "Software development is inherently complex, and the ever-growing number of tools and technologies is further adding to the cognitive load faced by developers."
- Team Topologies (Skelton & Pais, 2019): Three cognitive-load types — intrinsic (fundamental), extraneous (environment/tooling — should be eliminated), germane (value-add — should be maximised). "Limit the size of software services/products to the cognitive load that the team can handle."
- DORA 2024 State of DevOps (n=39,000+ over 9 years): Internal developer platforms reduce extraneous load and create standardized paths to production, but with mixed delivery effects (throughput −1.5%, stability −7.2%) when AI adoption is layered onto a weak underlying system.
- Gloria Mark (UC Irvine): average 23 min 15 sec to fully refocus after interruption (knowledge-worker context, not developer-specific RCT).
Bus factor / knowledge concentration
- Avelino et al. (ICPC 2016, n=133 popular GitHub projects): 65% had a Truck Factor ≤ 2 — two or fewer key developers' departure would incapacitate the project.
- Jabrayilzade et al. (ICSE 2022, n=269 engineers + JetBrains case study): many respondents had revived projects with bus factor = 0; documentation cited as the most-used mitigation.
- Dartford and Gravesham NHS Trust board paper (April 2025): end-of-life Cisco/Extreme network kit affecting EPR/EPMA/CDS systems, with the trust acknowledging "single points of failure in terms of skills."
6. Successful retirement and consolidation playbooks
Spotify — Golden Path / Backstage
- Spotify Engineering ("How We Use Golden Paths to Solve Fragmentation," Aug 2020) describes pre-Path culture as "rumour-driven development." Backstage's stated philosophy: "The fewer technologies we are world class on, the faster and more effective we get."
- Outcomes: time to set up a new service reduced from 14 days to under 5 minutes. Replaced 200+ standalone Jenkins machines with one CI tool (Tingle). Backstage adopted by 280+ engineering teams; 2,000+ backend services, 300+ websites, 4,000+ data pipelines onboarded.
- Backstage Tech Radar plugin uses lifecycle values Use, Trial, Assess, Hold — explicit retirement signal in the same artifact developers consume daily.
- Soundcheck plugin scores components against "Golden Tech standards"; falling short requires filing exceptions, approved by the Technology Architecture Group (TAG).
Netflix — Paved Road
- Dianne Marsh (Director of Engineering, OSCON 2017): "The Paved Road [is] a concept, formalizing a set of expectations and commitments between the centralized teams and our engineering customers… It is not mandatory for teams to use."
- Netflix Tech Blog (2016): "For a tool to be widely accepted, it must be compelling, add tremendous value, and reduce the overall cognitive load for the majority of Netflix engineers."
- Astha Singhal (Scaling Appsec): "We believe that driving adoption of these security controls reduces more application risk in our ecosystem than vulnerability remediation does."
Google — monorepo, Rosie, deprecation as engineering discipline
- Potvin & Levenberg, CACM July 2016: ~1B files, 86 TB, 35M commits, 2B+ LOC; 95% of Google source in single Piper repo; ~25,000 engineers, 16,000 human + 24,000 automated commits/day. "Special tooling automatically detects and removes dead code, splits large refactorings and automatically assigns code reviews (as through Rosie), and marks APIs as deprecated."
- Software Engineering at Google, Ch. 15 (Hyrum Wright) is the canonical engineering text on deprecation. Single most quotable line in support of the LinkedIn thesis: "Code is a liability, not an asset." Other gems: "It's often better to invest effort in turning off obsolete systems, rather than letting them lumber along indefinitely alongside the systems that replace them." And: "There's an old joke within Google that there are two ways of doing things: the one that's deprecated, and the one that's not-yet-ready." On political difficulty: "the costs of doing nothing and letting the system lumber along unattended are not readily observable." Google distinguishes Advisory vs Compulsory deprecation, the latter with hard deadlines and a dedicated removal team.
- Hyrum's Law: "With a sufficient number of users of an API, it does not matter what you promise in the contract: all observable behaviors of your system will be depended on by somebody." This is also the most-cited counterargument to forced retirement — it makes execution costlier than naive analysis suggests.
- arXiv "Software Engineering at Google" (Henderson 2017): "Most software at Google gets rewritten every few years."
- Google strongly limits primary production languages to a small set (C++, Java, Python, Go, JavaScript/TypeScript), with formal style guides governing each. The "exactly 5 languages" framing is a secondary-source simplification; the primary documentation is Software Engineering at Google Ch. 8.
Etsy — concrete consolidation outcomes
- Cloud migration (2018–2020): servers cut from ~3,000 to a few hundred; 75 of 500 engineers reallocated from infrastructure to product work; product development velocity more than doubled YoY (Etsy 2019 Q4 earnings). CTO Mike Fisher attributed +$260M in gross merchandise sales over two years to migration-enabled improvements.
- Vitess payments DB consolidation (2020–2022): 23 tables, 40B rows moved into a single sharded environment; 60% load reduction on primary payments DB; "scaling operations are no longer manual."
Other anchors
- LinkedIn (2017 onward): Public engineering write-up of decommissioning the inbox-war service (1,400 QPS → 0 over four months); InMail migration off Oracle moved 200M+ mailboxes in <3 months; Espresso migration to HTTP/2 produced 88% fewer TCP connections, 65–75% lower latency, 75–81% lower GC overhead.
- Hootsuite (Mesos → Kubernetes): 15 services migrated in 2 months; $67K/year saved; key driver = "only the core ops team understood Mesos."
- Airbnb sunset of React Native (June 2018): "Due to a variety of technical and organizational issues, we will be sunsetting React Native and putting all of our efforts into making native amazing."
- Shopify (modular monolith, the inverse pattern): Rejected microservices, chose modular monolith. 2.8M LoC Ruby; 400,000+ unit tests run on every monolith CI build; 173B requests on Black Friday 2024. Demonstrates that consolidation can mean resisting the new-service ratchet, not just retiring services.
- U.S. Air Force Air Combat Command rationalized $788M annual mission IT spend using Gartner TIME framework (Gartner doc 2206416).
Frameworks for retirement
- Gartner TIME (Tolerate / Invest / Migrate / Eliminate) — two axes (business value vs technical fit) — is industry-standard vocabulary for application portfolio management. Reported outcomes (vendor-published, treat directionally): 15–30% IT cost reduction; 22% run-cost reduction in named banking case (flevy).
- Zalando deprecation policy (github.com/zalando/restful-api-guidelines): concrete OpenAPI-level playbook using deprecated: true, HTTP Deprecation and Sunset headers, and required consumer consent before shutdown — a written, copyable artifact.
- CGOC study (cited via Brickendon): average $40K/year saved per decommissioned application; >$120K for larger applications.
- Gartner (older, via LeanIX): 70% of CIOs believe at least one-fifth of their applications could be consolidated by eliminating redundant functionality.
7. Counterpoints and nuance — the case against aggressive retirement
This is necessary for a balanced post:
- Joel Spolsky, "Things You Should Never Do, Part I" (April 6, 2000): "They [Netscape] decided to rewrite the code from scratch… the single worst strategic mistake that any software company can make." Core argument: "weird hairs" in old code are bug fixes that took real-world experience to discover. You "go dark" for 1–3 years during a rewrite. Netscape's 3-year v4→v6 gap ceded the browser market to IE.
- Hyrum's Law execution cost: Even when a sunsetting decision is correct, Software Engineering at Google describes Google's 2006 compiler upgrade as "extremely painful — many Hyrum's Law problems, big and small, had crept into the codebase and served to deepen our dependency on a particular compiler version." Hyrum Wright at WAPI 2017: "It takes more effort almost by an order of magnitude to kill an old system than it did to write it."
- W3C "Deprecation is Hard to Do" (TPAC, Sept 2024, Mozilla presentation): Forces against deprecation: "Unknown use cases, can not reach zero, but must try (Hyrum's Law); Outsized influence on smaller development ops; ecosystem implications, economics and incentives."
- Strangler Fig pattern (Martin Fowler) is the standard counter-counter — incremental, in-place retirement rather than a big-bang rewrite.
- Counter-evidence on aggressive retirement is largely anecdotal: there is no equivalent body of research showing enterprises retire too aggressively. The empirical literature is heavily skewed toward documenting under-retirement.
Frameworks worth quoting in the post
- Dan McKinley, "Choose Boring Technology" (June 2015, mcfunley.com): "Let's say every company gets about three innovation tokens." "'Boring' should not be conflated with 'bad.'… MySQL is boring. Postgres is boring. PHP is boring. Python is boring. The nice thing about boringness… is that the capabilities of these things are well understood. But more importantly, their failure modes are well understood." And: "Adding technology to your company comes with a cost… It is basically always the case that the long-term costs of keeping a system working reliably vastly exceed any inconveniences you encounter while building it."
- Charity Majors (charity.wtf, May 2023): extends innovation-token framing to organizational/cultural decisions; "You only get a few innovation tokens to spend, so you should spend them on technologies that can give you a true competitive advantage."
- Wardley Mapping (Simon Wardley): Y-axis visibility, X-axis evolution (Genesis → Custom → Product → Commodity). Components naturally evolve rightward; failing to retire internally-built components when commodity equivalents emerge is the central failure mode the framework is built to expose.
- Gregor Hohpe, 37 Things: "Architecture is selling options" — value comes from preserving optionality, not generating decisions; "top-down governance with weed killer is unlikely to have a lasting effect and usually does more harm than good."
8. Source-quality and bias notes for the writer
Highest-confidence primary sources (use freely):
- ThoughtWorks Radar in numbers page; Neal Ford / Rebecca Parsons quotes; ThoughtWorks blog
- US GAO reports (GAO-19-471, GAO-23-104719, GAO-23-106821, GAO-25-107611, GAO-25-107795)
- UK National Audit Office "Government cyber resilience" (Jan 2025)
- DSIT/Bain "State of Digital Government Review" (Jan 2025)
- Software Engineering at Google (O'Reilly 2020) — Chapters 8, 15, 22
- Spotify Engineering blog (Aug 2020); Netflix Tech Blog (2016, 2018)
- Stack Overflow Developer Survey (community-skewed but transparent methodology)
- McKinley "Choose Boring Technology"; Hohpe "Architect Elevator" / 37 Things
- ACM Queue papers: SPACE (2021), DevEx (2023), DevEx in Action (2024)
Treat as directionally useful but vendor-biased:
- Synopsys/Black Duck OSSRA, Snyk, Sonatype, Veracode, Contrast — all sell remediation tools.
- Productiv, BetterCloud, Zylo, Vendr, Okta — all sell SaaS-adjacent tooling. Note massive divergence in SaaS-app-count headline numbers (Okta 101 vs Productiv 342) — driven by methodology, not disagreement.
- McKinsey, Protiviti, OutSystems — sell consulting/platforms tied to modernization narrative. Sample sizes vary wildly (McKinsey 2020 = 50 CIOs; Protiviti 2023 = 1,050 execs).
- JetBrains DevEcosystem — vendor-recruited but transparent about weighting.
Statistics to flag if used:
- "Average enterprise uses 1,000+ SaaS apps" — not corroborated in primary sources; highest verified is 660 for 10,000+-employee orgs (Zylo 2025).
- "23 minutes to refocus" — Gloria Mark's research is broader knowledge-worker, not developer-specific.
- "800 billion lines of COBOL" is from a Micro Focus-commissioned survey; the more conservative Reuters 2017 figure is 220 billion.
- "NHS WannaCry was caused by Windows XP" is partly overstated — the bulk of vulnerable systems were unpatched Windows 7. The legacy/governance point still holds.
- "Every yes is a future no" — no clean primary attribution; closest is James Clear's "yes is time debt / no is time credit."
Single most quotable lines for the LinkedIn thesis:
- "Code is a liability, not an asset." — Hyrum Wright, Software Engineering at Google Ch. 15
- "The fewer technologies we are world class on, the faster and more effective we get." — Spotify Engineering Handbook, via Backstage 101
- "Hold is the closest we have to an avoid category, which Rebecca won't let us have." — Neal Ford, ThoughtWorks
- "Every company gets about three innovation tokens." — Dan McKinley, "Choose Boring Technology"
- "Strategy also includes 'retiring' systems (in the Blade Runner sense of the word) lest you want to live among Zombies." — Gregor Hohpe, 37 Things
- "The costs of doing nothing and letting the system lumber along unattended are not readily observable." — Software Engineering at Google Ch. 15
The single most powerful empirical anchor for the thesis: in 10+ years of ThoughtWorks Technology Radar curation by a 22-person senior technologist board, only two technologies (Enzyme and AngularJS) were ever demoted from a positive recommendation ring into Hold. That is the asymmetry, in numbers, from the inventor of the format.
- Thoughtworks — https://www.thoughtworks.com/content/dam/thoughtworks/documents/radar/2025/11/tr_technology_radar_vol_33_en.pdf
- Medium — https://ckoster22.medium.com/whats-on-your-tech-radar-9ad8769c8c1
- Thoughtworks — https://www.thoughtworks.com/insights/blog/build-your-own-technology-radar
- Thoughtworks — https://www.thoughtworks.com/insights/podcasts/technology-podcasts/build-your-own-radar-using-technology-radar-governance-tool
- Thoughtworks — https://www.thoughtworks.com/en-us/radar/faq/10-years-of-radar/radar-in-numbers
- Thoughtworks — https://www.thoughtworks.com/en-us/radar
- Thoughtworks — https://www.thoughtworks.com/radar
- LeanIX — https://www.leanix.net/en/wiki/ea/architecture-review-board
- Okoone — https://www.okoone.com/spark/leadership-management/how-to-make-architecture-review-boards-work-in-fast-moving-devops-teams/
- LinkedIn — https://www.linkedin.com/pulse/more-architecture-review-boards-please-bo-vincent-thomsen
- PDFCOFFEE.COM — https://pdfcoffee.com/37-things-one-architect-knows-about-it-transformation-pdf-free.html
- O'Reilly — https://www.oreilly.com/library/view/the-managers-path/9781491973882/
- Thoughtworks — https://www.thoughtworks.com/en-us/insights/blog/technology-strategy/how-to-create-your-enterprise-technology-radar
- npm — https://www.npmjs.com/package/@backstage-community/plugin-tech-radar
- Codegnan — https://codegnan.com/programming-language-popularity-statistics/
- Stack Overflow — https://stackoverflow.blog/2025/01/01/developers-want-more-more-more-the-2024-results-from-stack-overflow-s-annual-developer-survey/
- GitHub — https://github.blog/news-insights/octoverse/octoverse-a-new-developer-joins-github-every-second-as-ai-leads-typescript-to-1/
- GitHub — https://github.blog/news-insights/octoverse/octoverse-2024/
- Second Talent — https://www.secondtalent.com/resources/top-programming-usage-statistics/
- Socket — https://socket.dev/blog/python-overtakes-javascript-as-top-programming-language
- Red Hat — https://developers.redhat.com/articles/2021/06/08/achieving-polyglot-persistence-application-stream-databases-red-hat-enterprise
- ScienceDirect — https://www.sciencedirect.com/science/article/abs/pii/S0065245817300347
- JetBrains — https://www.jetbrains.com/lp/devecosystem-2024/
- Stack Overflow — https://survey.stackoverflow.co/2024/technology
- Stack Overflow — https://survey.stackoverflow.co/2025/technology/
- Productiv — https://productiv.com/blog/saas-statistics-that-every-it-manager-should-see/
- Productiv — https://productiv.com/blog/less-than-half-of-company-saas-applications-are-regularly-used-by-employees/
- Mi3 — https://www.mi-3.com.au/17-01-2025/licence-spill-multimillion-dollars-saas-wasteland-cmos-can-not-afford-ignore
- Zylo — https://zylo.com/reports/2025-saas-management-index/
- PR Newswire — https://www.prnewswire.com/news-releases/2024-saas-management-index-reveals-an-average-of-18m-in-annual-license-waste-with-significant-security-risks-from-employee-expensed-apps-302071679.html
- BetterCloud — https://www.bettercloud.com/monitor/saas-statistics/
- Computerworld — https://www.computerworld.com/article/1626273/survey-most-workers-would-welcome-digital-monitoring-to-boost-productivity.html
- eMonitor — https://www.employee-monitoring.net/resources/employee-productivity-benchmarks-2026
- Business Wire — https://www.businesswire.com/news/home/20210915005244/en/Less-than-Half-of-Company-SaaS-Applications-Are-Regularly-Used-by-Employees
- DevOps — https://devops.com/survey-sees-massive-adoption-of-microservices/
- Statista — https://www.statista.com/statistics/1236823/microservices-usage-per-organization-size/
- Gartner — https://www.gartner.com/peer-community/oneminuteinsights/omi-microservices-architecture-have-engineering-organizations-found-success-u6b
- Who is Nnamdi? — https://whoisnnamdi.com/leaving-software-on-the-table/
- InfoQ — https://www.infoq.com/news/2024/03/tech-debt-software/
- Stripe — https://stripe.com/files/reports/the-developer-coefficient.pdf
- Medium — https://medium.com/understanding-tech-debt/the-cost-of-technical-debt-5250f1f8a24e
- McKinsey & Company — https://www.mckinsey.com/capabilities/mckinsey-digital/our-insights/tech-debt-reclaiming-tech-equity
- McKinsey & Company — https://www.mckinsey.com/capabilities/mckinsey-digital/our-insights/breaking-technical-debts-vicious-cycle-to-modernize-your-business
- McKinsey & Company — https://www.mckinsey.com/capabilities/mckinsey-digital/our-insights/demystifying-digital-dark-matter-a-new-standard-to-tame-technical-debt
- Protiviti — https://www.protiviti.com/us-en/global-technology-executive-survey-tech-debt-major-burden
- GuruFocus — https://www.gurufocus.com/news/1972096/technical-debt-and-skills-shortages-threaten-to-stifle-innovation-according-to-protiviti-survey
- U.S. GAO — https://www.gao.gov/products/gao-23-106821
- U.S. GAO — https://www.gao.gov/blog/outdated-and-old-it-systems-slow-government-and-put-taxpayers-risk
- U.S. GAO — https://www.gao.gov/products/gao-21-524t
- Servicenetwork — https://www.servicenetwork.org/wp-content/uploads/2016/08/run_grow_and_transform_IT_biz_spend_308477.pdf
- RoadmapOne — https://roadmap.one/blog/posts/blog6-1-run-grow-transform/
- Gao — https://files.gao.gov/reports/GAO-25-107795/index.html
- U.S. GAO — https://www.gao.gov/products/gao-25-107795
- U.S. GAO — https://www.gao.gov/products/gao-16-696t
- mLogica — https://www.mlogica.com/resources/blogs/agencies-need-to-continue-addressing-critical-legacy-systems
- The Washington Post — https://www.washingtonpost.com/politics/2023/02/24/irs-technology-gao-report-archaic/
- Gao — https://files.gao.gov/reports/GAO-25-107611/index.html
- U.S. GAO — https://www.gao.gov/products/gao-23-104719
- The Register — https://www.theregister.com/2025/01/29/nao_blasts_uk_gov_cyber/
- Computer Weekly — https://www.computerweekly.com/news/366618552/NAO-UK-government-cyber-resilience-weak-in-face-of-mounting-threats
- National Audit Office — https://www.nao.org.uk/press-releases/cyber-threat-to-uk-government-is-severe-and-advancing-quickly-spending-watchdog-finds/
- Infosecurity Magazine — https://www.infosecurity-magazine.com/news/scores-critical-government-it/
- Data Center Dynamics — https://www.datacenterdynamics.com/en/news/report-finds-28-of-uks-central-govt-it-still-considered-legacy/
- Burendo — https://burendo.com/insights/blogs/the-hidden-technical-debt-in-your-legacy-platforms/
- Netguru — https://www.netguru.com/blog/legacy-software-cost-uk
- Computer Weekly — https://www.computerweekly.com/news/252466838/NHS-still-has-thousands-of-PCs-running-Windows-XP
- Tripwire — https://www.tripwire.com/state-of-security/nhs-computers-running-windows-xp
- Verdict — https://www.verdict.co.uk/windows-xp-nhs/
- Tech Monitor — https://www.techmonitor.ai/digital-economy/government-computing/legacy-technology-costs-uk-public-sector-45bn-annually
- Htn — https://htn.co.uk/2026/04/20/htn-trust-region-series-south-east/
- OutSystems — https://www.outsystems.com/digital-transformation/how-to-modernize-legacy-applications/
- Black Duck — https://www.blackduck.com/blog/ossra-addresses-common-open-source-questions.html
- PR Newswire — https://www.prnewswire.com/news-releases/new-black-duck-report-86-of-commercial-codebases-contain-vulnerable-open-source-exposing-organizations-to-security-risks-302383713.html
- CinchOps, LLC — https://cinchops.com/black-duck-2025-open-source/
- Digital IT News — https://digitalitnews.com/new-black-duck-ossra-report-released/
- Synopsys — https://news.synopsys.com/2024-02-27-New-Synopsys-Report-Finds-74-of-Codebases-Contained-High-Risk-Open-Source-Vulnerabilities,-Surging-54-Since-Last-Year
- Sonatype — https://www.sonatype.com/press-releases/sonatypes-10th-annual-state-of-the-software-supply-chain-report
- GlobeNewswire — https://www.globenewswire.com/news-release/2024/10/10/2961239/0/en/Sonatype-s-10th-Annual-State-of-the-Software-Supply-Chain-Report-Reveals-156-Surge-in-Open-Source-Malware.html
- Sonatype — https://www.sonatype.com/state-of-the-software-supply-chain/2024/introduction
- Sonatype — https://www.sonatype.com/state-of-the-software-supply-chain/2024/10-year-look
- Business Wire — https://www.businesswire.com/news/home/20250227022178/en/Veracode-Reveals-Half-of-Organizations-Burdened-by-Critical-Security-Debt-with-70-Stemming-from-Third-party-Code-and-the-Software-Supply-Chain
- Veracode — https://www.veracode.com/press-release/veracode-research-reveals-government-applications-at-heightened-risk-of-cyber-attack
- Snyk — https://snyk.io/blog/2024-open-source-security-report-slowing-progress-and-new-challenges-for/
- Snyk — https://view.snyk.io/the-state-of-open-source-report-2024/p/1
- TechCrunch — https://techcrunch.com/sponsor/snyk/the-current-and-future-state-of-open-source-security-research-from-snyk-and-the-linux-foundation/
- Veracode — https://www.veracode.com/blog/state-of-log4j-vulnerabilities-how-much-did-log4shell-change/
- Infosecurity Magazine — https://www.infosecurity-magazine.com/news/twofifths-log4j-apps-vulnerable/
- Contrast Security — https://www.contrastsecurity.com/security-influencers/log4shell-vulnerability-log4j-still-being-exploited-contrast-security-adr
- IBM — https://www.ibm.com/think/topics/log4j-vulnerability-detection-patching
- The Cyber Express — https://thecyberexpress.com/cisa-known-exploited-vulnerabilities-kev-2025/
- SecurityWeek — https://www.securityweek.com/cisa-kev-catalog-expanded-20-in-2025-topping-1480-entries/
- InfoQ — https://www.infoq.com/news/2024/05/new-relic-java-2024/
- New Relic — https://newrelic.com/resources/report/2023-state-of-the-java-ecosystem
EDITORIAL BRIEF
Commissioned from our research desk. Subject to final editorial discretion.
The uncomfortable reality that most technology radar and tech adoption governance processes optimize for saying no to new things while doing almost nothing to force retirement of old things. Explore how the asymmetry creates an ever-expanding surface area of supported technologies, each with its own maintenance tail, security exposure, and hiring constraint. Pull data on average number of languages, frameworks, and data stores in mid-to-large enterprise environments. The reader should reconsider whether their governance energy is pointed in the right direction.