Why designing against a vendor's roadmap is one of the most under-scrutinized bets in technical strategy
BY STAVROS · AUGUST 25, 2026
The proof is indisputable.
THE INSIGHT
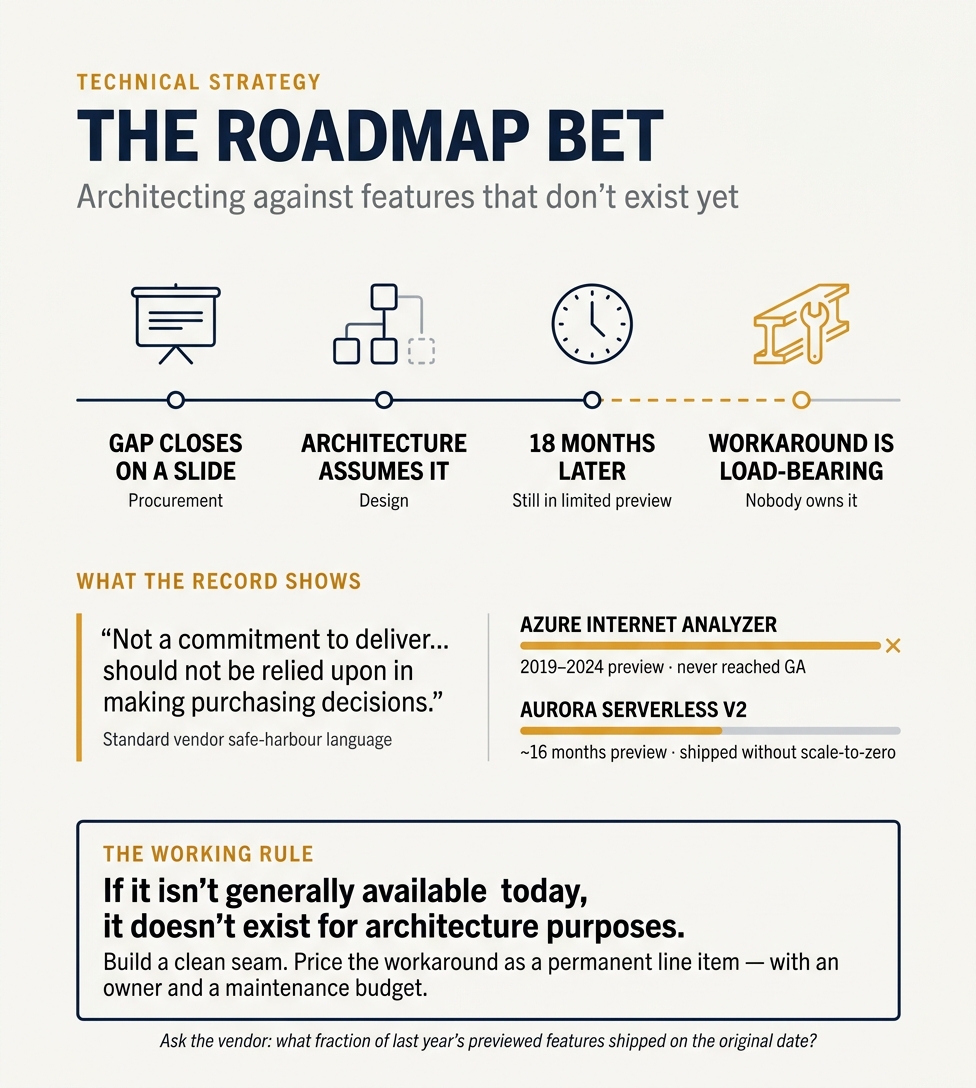
There is a moment in most procurement cycles that never makes it into the decision record. Someone identifies a genuine capability gap, the vendor's solutions architect says the feature lands next quarter, and the gap closes on a slide. The architecture is then drawn as though the feature exists. Eighteen months later it is still in limited preview, and the "temporary" adapter someone wrote to bridge the gap is now processing production traffic the business cannot live without.
We rarely scrutinise this bet the way we would a database choice. We will run a three week bake off on a message broker, then accept a delivery date from a company that has already told us, in writing, not to accept it.
Read that literally. Oracle's safe harbour language says its roadmap statements are not a commitment to deliver any functionality and should not be relied upon in making purchasing decisions. Salesforce and Workday say the same. Every hyperscaler's preview terms disclaim any warranty that a preview feature will ever reach general availability. Google publishes an average preview length of roughly six months, and Microsoft's own documentation states there is no fixed timeline for a preview reaching GA.
Azure Internet Analyzer sat in public preview from 2019 until Microsoft switched it off in 2024, never reaching GA. Aurora Serverless v2 spent about sixteen months in preview and shipped without v1's scale to zero behaviour, which did not return until late 2024. Anyone who architected around the announcement paid for capacity they were told they would not need, for the better part of three years.
The contract almost never helps. No reliance clauses exist to make sales cycle enthusiasm unenforceable, so slippage that costs you two quarters of engineering effort has no remedy attached. A Gartner hype cycle position tells you nothing here either. Those time to plateau bands describe adoption for a category, not one vendor's ship date.
The expensive half is the workaround. It calcifies, because nothing forces its removal once the real capability slips, and sunk cost makes us defend it. McKinsey puts technical debt at 20 to 40% of the value of the technology estate, and found one insurer where it had never appeared in a business case. It does not show up as a failed project. It shows up as a load bearing component nobody owns.
So my working rule: if a capability is not generally available today, it does not exist for architecture purposes. Build a clean seam where it will eventually slot in, then price the workaround as a permanent line item, with an owner and a maintenance budget. If owning it forever is unaffordable, that is your answer.
And ask the vendor what fraction of last year's previewed features shipped on the original date. The answer, or the refusal, tells you how to weight the roadmap.
THE EVIDENCE
Research brief: designing architecture against a vendor's roadmap
TL;DR
- Vendor roadmaps are software estimates with a sales incentive attached, and the vendors themselves say so in writing: Oracle, Salesforce, Workday and others disclaim every roadmap statement, and every hyperscaler's preview terms let them change, delay or kill a feature at will with no SLA and no promise it ever reaches general availability (GA).
- The workaround you build while you wait is the real risk: technical debt already eats 20 to 42 percent of engineering time and 20 to 40 percent of the technology estate's value, temporary integration glue is exactly what Lehman's laws and the tech-debt research say will calcify, and large IT projects run 45 percent over budget with 17 percent going so badly they threaten the company.
- Good practice is not to trust or distrust the roadmap but to price the workaround as permanent, isolate the vendor behind an abstraction layer, and set an explicit decision date and kill criterion; ask the vendor for named production reference customers, not a slide.
Key findings
1. Vendors disclaim their own roadmaps in writing
- Oracle's "Safe Harbor" slide is the canonical example. Verbatim: "The following is intended to outline our general product direction. It is intended for information purposes only, and may not be incorporated into any contract. It is not a commitment to deliver any material, code, or functionality, and should not be relied upon in making purchasing decisions. The development, release, and timing of any features or functionality described for Oracle's products remains at the sole discretion of Oracle."
- Salesforce uses near-identical language: "Any unreleased services or features referenced in this or other presentations, press releases or public statements are not currently available and may not be delivered on time or at all. Customers who purchase our services should make the purchase decisions based upon features that are currently available."
- Workday: "Any unreleased services, features, functionality, or enhancements referenced in a Workday document, roadmap, blog, website, press release, or public statement that are not currently available are subject to change at Workday's discretion and may not be delivered as planned or at all. Customers who purchase our applications should make their purchase decisions based upon features and functions that are currently available."
- These are not throwaway lines. They are grounded in the forward-looking-statement safe harbour of the US Private Securities Litigation Reform Act of 1995 (sections 27A of the Securities Act of 1933 and 21E of the Securities Exchange Act of 1934), which protects companies from liability for predictions that do not come true. The same legal shield that protects them from investors protects them from you.
2. Preview / beta terms give the vendor total discretion and no obligation
- AWS Service Terms (Beta Service and Beta Region): "AWS IS PROVIDING BETA SERVICES AND BETA REGIONS TO YOU 'AS IS.' AWS AND ITS AFFILIATES AND LICENSORS MAKE NO REPRESENTATIONS OR WARRANTIES OF ANY KIND ... INCLUDING ANY WARRANTY THAT THE BETA SERVICES AND BETA REGIONS WILL BECOME GENERALLY AVAILABLE, BE UNINTERRUPTED, ERROR FREE ..." AWS may also add, modify, or remove functionality, and access terminates automatically on GA or on notice.
- Google Cloud Pre-GA Offerings Terms: "PRE-GA OFFERINGS ARE PROVIDED 'AS IS' WITHOUT ANY EXPRESS OR IMPLIED WARRANTIES OR REPRESENTATIONS OF ANY KIND." And: Pre-GA Offerings "(a) may be changed, suspended or discontinued at any time without prior notice to Customer and (b) are not covered by any SLA or Google indemnity." Google's liability for pre-GA offerings is capped at the lesser of the contract cap or 25,000 US dollars. Google's healthcare API page states pre-GA features "are not guaranteed to graduate to other launch stages ... have no deprecation policy, and might be subject to backward-incompatible changes."
- A standard SaaS "Beta Services" clause (appearing in 33 contracts on Law Insider) reads: "We may discontinue Beta Services at any time in Our sole discretion and may never make them generally available. We will have no liability for any harm or damage arising out of or in connection with a Beta Service."
- Azure: Microsoft documentation states there is "no fixed timeline for when a preview feature moves to general availability (GA)," and preview services are provided "as is" with no SLA and limited or no support. Microsoft's own guidance is that you should never use non-GA services for production.
3. How long previews actually last, and whether they graduate
- Google is the only major vendor that publishes an average: "The average Preview stage lasts about six months" (and similar ~6-month figures for alpha and beta). Google Maps Platform previews are "typically expected to reach GA within 12 months, but this may vary." Notably, AWS and Microsoft do not publish any comparable average; Microsoft's own docs say there is no fixed timeline. [1][2]
- Documented long previews and previews that never made GA:
Azure Internet Analyzer: public preview announced November 2019; Microsoft announced discontinuation with data deletion on 15 March 2024, i.e. killed in preview after roughly four years, never reaching GA. Microsoft: "this tool didn't achieve the level of customer traction we had hoped for." [3]
Azure App Service "Shared Plan": after many years in preview, Microsoft told Directions on Microsoft it would go GA "Never," while still charging for the preview compute.
Azure Blueprints: in preview from 2018 and then deprecated (migration to Template Specs and Deployment Stacks) without ever reaching GA.
Amazon Aurora Serverless v2: announced in preview at re:Invent (December 2020), reached GA 21 April 2022, about 16 months in preview; and at GA it dropped v1's scale-to-zero capability, which did not return until November 2024, so customers who bet on the v2 roadmap paid a minimum-capacity charge for about 2.5 years. [4]
Azure Portal: went GA "after nearly nineteen months in 'preview'" (InfoQ). [5]
- Azure Internet Analyzer: public preview announced November 2019; Microsoft announced discontinuation with data deletion on 15 March 2024, i.e. killed in preview after roughly four years, never reaching GA. Microsoft: "this tool didn't achieve the level of customer traction we had hoped for." [3]
- Azure App Service "Shared Plan": after many years in preview, Microsoft told Directions on Microsoft it would go GA "Never," while still charging for the preview compute.
- Azure Blueprints: in preview from 2018 and then deprecated (migration to Template Specs and Deployment Stacks) without ever reaching GA.
- Amazon Aurora Serverless v2: announced in preview at re:Invent (December 2020), reached GA 21 April 2022, about 16 months in preview; and at GA it dropped v1's scale-to-zero capability, which did not return until November 2024, so customers who bet on the v2 roadmap paid a minimum-capacity charge for about 2.5 years. [4]
- Azure Portal: went GA "after nearly nineteen months in 'preview'" (InfoQ). [5]
- Directions on Microsoft, an independent Microsoft analyst firm, treats long previews as a warning sign: "the longer a Microsoft preview, the less likely a technology will reach GA." Their analyst Rob Sanfilippo: "Other times, priorities change before a product reaches general availability, and teams could be dissolved or refocused." [3]
4. Vendors kill GA products too (not just previews)
- The "Killed by Google" dataset contains 299 discontinued products with an average product lifespan of 5.2 years, per the analysis visualised by sheets.works and Abakcus: "the count stands at 299. The average lifespan of a Google product: 5.2 years." This includes GA enterprise products: Google Cloud IoT Core went to beta in 2017, GA in early 2018, and was retired effective 16 August 2023 with about one year's notice. Google's stated reason: "our customers' needs could be better served by our network of partners." Google Reader, which at shutdown "had around 30 million active users" (per the same Killed by Google analysis; Google's Urs Hölzle cited declining usage in March 2013), and Google Cloud Print are other examples. [6]
- This matters for architecture because a feature reaching GA is necessary but not sufficient: the capability you designed around can still be deprecated. Google Cloud's standard deprecation policy gives a minimum of 12 months' notice for GA products, but pre-GA offerings have no deprecation policy at all.
5. Contracts almost never commit the vendor to deliver future functionality
- The market-standard drafting is designed to neutralise sales-cycle promises: "entire agreement" / integration clauses (the contract supersedes all prior representations), no-reliance clauses, and broad disclaimers of warranties. Combined with the roadmap disclaimers above, a buyer who relied on a roadmap slide usually has no contractual hook.
- Gartner's own contracting guidance tells buyers to add what vendors do not offer by default: "Include a Functional Description of All Licensed Technology in a License Purchase or SaaS Subscription, and Include a 'Not-to-Diminish' Clause." In other words, warrant the functionality that exists as of the effective date and forbid its degradation; roadmap items sit outside this.
- What buyers can realistically ask for instead of a roadmap warranty: functionality warranties tied to current documentation as of the effective date; non-degradation / non-deprecation commitments; price protection and renewal caps; termination-for-convenience rights if a promised capability does not ship by a date; milestone or acceptance-based payment; source-code or data escrow; and exit / transition assistance.
- Legal disputes show how the promises get tested, and how hard they are to win:
Waste Management v. SAP (2008): WM sued SAP for fraud in March 2008, claiming "more than $100 million it spent on the project" plus "more than $350 million for benefits" (Computerworld/InfoWorld); the damages sought rose toward 500 million US dollars by 2010 (CIO). WM alleged SAP demonstrated a "mock-up" that was "rigged and manipulated to depict false functionality." The case settled with a one-time cash payment.
MillerCoors v. HCL (2017): 100 million US dollar suit alleging the integrator "failed to deliver an enterprise software solution ... on time and in accordance with the requirements."
Copart v. Sparta Consulting (E.D. Cal. 2017): customer alleged a false statement that the firm had "ALL the information to identify 100% of functionality"; survived summary judgment and a jury awarded more than 20 million US dollars.
Marin County v. Deloitte: 30 million US dollar suit alleging "fraud, misconduct and misrepresentation" over a botched SAP implementation.
The recurring legal theme: sales-cycle representations are often dismissed as "puffery" or defeated by integration and no-reliance clauses. Practitioner guidance (Taft, Vondran, Bloomberg Law) is that vendor contracts "heavily favor the vendor" and fraud must be pleaded with specificity. Winning requires proving reliance the contract was specifically drafted to disclaim.
- Waste Management v. SAP (2008): WM sued SAP for fraud in March 2008, claiming "more than $100 million it spent on the project" plus "more than $350 million for benefits" (Computerworld/InfoWorld); the damages sought rose toward 500 million US dollars by 2010 (CIO). WM alleged SAP demonstrated a "mock-up" that was "rigged and manipulated to depict false functionality." The case settled with a one-time cash payment.
- MillerCoors v. HCL (2017): 100 million US dollar suit alleging the integrator "failed to deliver an enterprise software solution ... on time and in accordance with the requirements."
- Copart v. Sparta Consulting (E.D. Cal. 2017): customer alleged a false statement that the firm had "ALL the information to identify 100% of functionality"; survived summary judgment and a jury awarded more than 20 million US dollars.
- Marin County v. Deloitte: 30 million US dollar suit alleging "fraud, misconduct and misrepresentation" over a botched SAP implementation.
- The recurring legal theme: sales-cycle representations are often dismissed as "puffery" or defeated by integration and no-reliance clauses. Practitioner guidance (Taft, Vondran, Bloomberg Law) is that vendor contracts "heavily favor the vendor" and fraud must be pleaded with specificity. Winning requires proving reliance the contract was specifically drafted to disclaim.
6. What Gartner Hype Cycle placement does and does not tell you
- The Hype Cycle plots five phases: Innovation Trigger, Peak of Inflated Expectations, Trough of Disillusionment, Slope of Enlightenment, Plateau of Productivity. Introduced by Jackie Fenn in 1995.
- Gartner uses time-to-plateau bands, marked by dot colour: less than 2 years, 2 to 5 years, 5 to 10 years, more than 10 years, and "obsolete before plateau." Gartner says it often takes an innovation "between three and five years" to move through the cycle, "but some fall off along the way."
- Crucial caveat for architecture: the band is a market-adoption estimate, not a delivery date for a specific vendor's specific feature. A technology being on the Slope of Enlightenment says nothing about whether the capability your chosen vendor previewed will ship next quarter.
- Predictive-accuracy critiques:
Michael Mullany's "8 Lessons from 20 Years of Hype Cycles" (2016) reviewed every Emerging Technologies Hype Cycle from 1995 to 2016. Findings include: many technologies never traverse the curve; a surprising number simply disappeared from the Hype Cycle rather than reaching the plateau; and there were major false-negative misses too (technologies that became mainstream while barely being noticed). This is the most-cited longitudinal review and is a first-hand analysis of the full dataset.
A commonly cited summary (via The Economist, summarising Gartner's own retrospectives) is that only about 20 percent of emerging technologies traverse the full curve to the Plateau of Productivity, with the majority stalling in the Trough. Flag: this "20 percent" figure is widely repeated but hard to trace to a single primary Gartner publication, so treat it as directional.
The "obsolete before plateau" marker is Gartner's own admission that some technologies die in the cycle. 3D printing (consumer) is a common cautionary example: peak around 2012, then a long trough.
- Michael Mullany's "8 Lessons from 20 Years of Hype Cycles" (2016) reviewed every Emerging Technologies Hype Cycle from 1995 to 2016. Findings include: many technologies never traverse the curve; a surprising number simply disappeared from the Hype Cycle rather than reaching the plateau; and there were major false-negative misses too (technologies that became mainstream while barely being noticed). This is the most-cited longitudinal review and is a first-hand analysis of the full dataset.
- A commonly cited summary (via The Economist, summarising Gartner's own retrospectives) is that only about 20 percent of emerging technologies traverse the full curve to the Plateau of Productivity, with the majority stalling in the Trough. Flag: this "20 percent" figure is widely repeated but hard to trace to a single primary Gartner publication, so treat it as directional.
- The "obsolete before plateau" marker is Gartner's own admission that some technologies die in the cycle. 3D printing (consumer) is a common cautionary example: peak around 2012, then a long trough.
- Related but distinct tools: the Magic Quadrant rates current vendors on completeness of vision and ability to execute (a present-tense competitive snapshot, not a timeline); the Priority Matrix maps benefit against years-to-adoption. None of these is designed to be a procurement or architecture delivery timeline.
7. The workaround calcification problem (this is the expensive half)
- Technical debt is large and measured:
Stripe's "The Developer Coefficient" (2018, survey of 1,000+ developers and 1,000+ C-level executives across five countries): developers spend about 13.5 hours per week on technical debt plus 3.8 hours on bad code and maintenance, totalling 17.3 hours of a 41.1-hour week, about 42 percent. Stripe extrapolated roughly 3 trillion US dollars in lost global GDP.
McKinsey ("Tech debt: Reclaiming tech equity," 2020, survey of ~50 CIOs, later expanded to ~220): tech-debt principal is "up to 40 percent of IT balance sheets"; CIOs estimate tech debt at 20 to 40 percent of the entire technology estate's value before depreciation; 69 percent of respondents were using more than 10 percent of new-project spend to resolve tech debt; and roughly 30 percent said more than 20 percent of budget nominally for new products is diverted to tech debt. 60 percent said tech debt had risen perceptibly over three years.
- Stripe's "The Developer Coefficient" (2018, survey of 1,000+ developers and 1,000+ C-level executives across five countries): developers spend about 13.5 hours per week on technical debt plus 3.8 hours on bad code and maintenance, totalling 17.3 hours of a 41.1-hour week, about 42 percent. Stripe extrapolated roughly 3 trillion US dollars in lost global GDP.
- McKinsey ("Tech debt: Reclaiming tech equity," 2020, survey of ~50 CIOs, later expanded to ~220): tech-debt principal is "up to 40 percent of IT balance sheets"; CIOs estimate tech debt at 20 to 40 percent of the entire technology estate's value before depreciation; 69 percent of respondents were using more than 10 percent of new-project spend to resolve tech debt; and roughly 30 percent said more than 20 percent of budget nominally for new products is diverted to tech debt. 60 percent said tech debt had risen perceptibly over three years.
- "Temporary" becomes permanent by default. Lehman's laws of software evolution (formulated from 1974) describe continuing change, increasing complexity and declining quality: a long-lived system's complexity rises with each change unless effort is spent counteracting it. Integration glue, adapters and shadow scripts written as bridges are exactly the components that outlive the systems they were meant to bridge, because nothing forces their removal once the "real" capability is deferred. This is the strangler pattern in reverse: the workaround quietly becomes the system of record.
- Operational risk of unowned load-bearing components: single points of failure, bus-factor-one scripts, and undocumented integrations that nobody owns. Southwest Airlines' December 2022 scheduling collapse is the widely-cited example of legacy/technical-debt-driven operational failure: per Southwest's SEC filing as reported by AP/NPR (18 December 2023), it cost "more than $1.1 billion in refunds and reimbursements, extra costs and lost ticket sales" and cancelled 16,700 flights between 21 and 31 December, stranding more than 2 million travellers.
- Decision-making biases that make this predictable rather than bad luck:
Planning fallacy and optimism bias (Kahneman and Tversky; Lovallo and Kahneman, "Delusions of Success," HBR 2003): forecasters systematically underestimate time and cost by taking an "inside view."
Reference class forecasting (Flyvbjerg) is the recommended cure: base your estimate on the actual outcomes of a class of similar past projects, not a bottom-up plan. Flyvbjerg's megaproject data (rail, bridge/tunnel, road) shows average real-terms cost overruns of 45, 34 and 20 percent respectively, and "black swan" IT projects (Budzier and Flyvbjerg) average 200 percent cost overrun. The UK Treasury Green Book has required optimism-bias uplifts since 2003.
Escalation of commitment and the sunk-cost effect: research on IT project escalation shows willingness to keep funding a failing project rises with sunk cost and with perceived nearness to completion. This is precisely why a workaround with time and money already in it does not get removed even after the "real" capability ships.
- Planning fallacy and optimism bias (Kahneman and Tversky; Lovallo and Kahneman, "Delusions of Success," HBR 2003): forecasters systematically underestimate time and cost by taking an "inside view."
- Reference class forecasting (Flyvbjerg) is the recommended cure: base your estimate on the actual outcomes of a class of similar past projects, not a bottom-up plan. Flyvbjerg's megaproject data (rail, bridge/tunnel, road) shows average real-terms cost overruns of 45, 34 and 20 percent respectively, and "black swan" IT projects (Budzier and Flyvbjerg) average 200 percent cost overrun. The UK Treasury Green Book has required optimism-bias uplifts since 2003.
- Escalation of commitment and the sunk-cost effect: research on IT project escalation shows willingness to keep funding a failing project rises with sunk cost and with perceived nearness to completion. This is precisely why a workaround with time and money already in it does not get removed even after the "real" capability ships.
8. Software delivery dates in general are unreliable, which is the base rate for any roadmap
- McKinsey / University of Oxford (5,400+ IT projects, with the BT Centre for Major Programme Management): large IT projects (initial budget over 15 million US dollars) run on average 45 percent over budget and 7 percent over time while delivering 56 percent less value than predicted; software projects have the highest risk of overruns; each additional year of scheduled duration adds about 15 percent to cost overrun; and 17 percent of projects "go so bad that they can threaten the very existence of the company" (black swans with 200 to 400 percent overruns). Companion academic study: Flyvbjerg and Budzier, HBR 2011, 1,471 projects, one in six a black swan (average 200 percent cost overrun, almost 70 percent schedule overrun).
- Standish CHAOS: the original 1994 report found about 16 percent of projects succeeded (on time, on budget), 53 percent challenged, 31 percent failed; later reports hover around 30 percent success. Use with an explicit health warning: CHAOS is heavily criticised in peer-reviewed work (Eveleens and Verhoef, IEEE Software 2010, "The Rise and Fall of the Chaos Report Figures"; Robert Glass) for opaque methodology, undisclosed project-selection criteria, restricted data access, and a narrow success definition (on time / on budget / all features). Cite it as contested, not authoritative.
- The synthesis point for the brief: a vendor roadmap is a software estimate produced by people who have both the normal optimism bias and a commercial incentive to close your deal. There is no reason to expect it to beat the base rates above, and several reasons to expect it to be worse.
9. When betting on a roadmap pays off, and what distinguishes those bets
- Clean, publicly documented "we bet on the preview and won" enterprise case studies are scarce. The closest concrete positive example is Aurora Serverless v1: practitioner Jeremy Daly adopted it from its re:Invent 2017 preview through GA about nine months later and then moved production workloads on with success. The distinguishing features were a short, firm preview-to-GA window and a vendor with a strong shipping track record, plus empirical validation before committing.
- The pattern across design-partner literature (First Round Review / Sierra, Bessemer) is that early-access bets pay off when they are backed by: contractual commitment with skin in the game on both sides (agreements that look like paid enterprise contracts, not informal pilots); a hard conversion / GA date; formal programs with "success plans" defining what will be tested and how progress is measured; and design-partner status that gives you influence over the feature. A public "preview" label with none of these is the weak version.
- The actionable filter: a roadmap bet is defensible when you have (a) a named production reference customer already live on the capability, (b) a contractual early-access agreement with a firm date and a remedy if it slips, and (c) a vendor track record you have actually checked. It is a gamble when you have a slide and a sales rep's confidence.
10. Good architectural practice against roadmap risk
- Isolate the vendor behind an abstraction layer / anti-corruption layer (ACL) so the promised capability can be swapped in later without rewriting the domain. Microsoft's own Azure Architecture Center documents the ACL pattern; the explicit benefit is reduced coupling and reduced vendor lock-in. Design in "seams" and feature flags so you can switch implementations.
- Price the workaround as a permanent cost of ownership in the business case. Standard TCO models leave it out entirely, which is exactly how a "temporary" bridge escapes scrutiny. McKinsey found that in one insurer, tech debt was 15 to 60 percent of every dollar spent on IT and "had not been accounted for in the business cases."
- Set an explicit decision date and a kill criterion at the outset (e.g. "if the capability is not GA with a named reference customer by date X, we build/buy the permanent alternative and delete the workaround"). Assign a named owner to the workaround so it is not an orphan.
- Run a reference-class forecast on the roadmap item: what proportion of comparable previewed features from this vendor shipped on the promised date? Apply an optimism-bias uplift rather than the vendor's date.
- Ask the vendor for named reference customers already in production (not in preview) on the exact capability, and for the preview/GA terms in writing. Treat "coming soon" as "not available."
Details and source attribution
Named sources appear inline above. The strongest, most citable primary sources are: Oracle Safe Harbor slide text; Salesforce and Workday safe-harbor pages; AWS Service Terms; Google Cloud Service Specific Terms (Pre-GA) and Product launch stages page; McKinsey "Tech debt: Reclaiming tech equity" (2020) and "Delivering large-scale IT projects on time, on budget, and on value" (2012); Stripe "The Developer Coefficient" (2018); Michael Mullany "8 Lessons from 20 Years of Hype Cycles" (2016); Eveleens and Verhoef (2010) for the CHAOS critique; Flyvbjerg on reference-class forecasting and megaproject overruns; Directions on Microsoft on perpetual previews; Bloomberg Law and Panorama Consulting for ERP litigation; Southwest's SEC filing as reported by AP/NPR for the operational-failure figure; and the Killed by Google dataset (as visualised by sheets.works/Abakcus) for the 299-products / 5.2-year figures.
Recommendations
- Treat any capability that is not GA today as "does not exist" for architecture purposes. Design the system so it works with what is shippable now, and design a clean seam where the future capability will slot in.
- Before committing, get three things from the vendor in writing: the preview/GA terms, a firm GA date with a contractual remedy if it slips (termination for convenience, price credit, or milestone payment), and at least one named production reference customer on the exact capability. If you cannot get all three, budget the workaround as permanent.
- Put the workaround in the TCO model as a permanent line item with a named owner, a maintenance budget, and a documented single-point-of-failure risk. If it is too expensive to own forever, that is your signal not to build it.
- Set a decision date and a kill criterion at design time, and diarise it. Benchmarks that should change the decision: capability reaches GA with a reference customer (proceed to migrate and delete the workaround); capability slips a second promised date or stays in preview past your reference-class-adjusted estimate (invoke the contingency); vendor deprecates or reprices the capability (invoke exit rights).
- Ask the vendor's roadmap owner, on the record, what proportion of last year's previewed features shipped on their original date. The answer, or the refusal, tells you how to weight this roadmap.
Caveats
- Strongly documented (safe to publish): the vendor disclaimer and preview-terms quotes (primary sources); McKinsey and Stripe technical-debt figures; McKinsey/Oxford project-overrun figures; the existence and phases of the Hype Cycle; Mullany's retrospective; the CHAOS critique; the named ERP lawsuits and their headline numbers; Google's ~6-month average preview figure; the Azure Internet Analyzer, Aurora Serverless v2 and Google IoT Core timelines; the Southwest 1.1 billion US dollar / 16,700-flight figures (from Southwest's SEC filing).
- Directional / contested (hedge when publishing): the "about 20 percent of technologies reach the plateau" figure (widely cited, hard to source to one Gartner primary); the exact damages figures in some ERP suits (several settled confidentially, so headline numbers are amounts claimed, not amounts paid); the "42 percent of developer time" figure (a self-reported survey average, not observed data); Standish CHAOS numbers (methodologically criticised, cite only as contested).
- Thin evidence: clean public case studies of enterprises winning a preview-roadmap bet; and any published head-to-head "announced vs delivered" scorecard comparing vendors' roadmap delivery rates. If you want to make a vendor-specific claim about track record, verify it directly rather than relying on the secondary characterisations here.
- One nuance to keep honest: GA is necessary but not sufficient, and rushed GA is itself a risk. Directions on Microsoft argues the GA label has been diluted (for example, products declared GA after only limited private testing), so "wait for GA" is a floor, not a guarantee.
- google — https://cloud.google.com/products/iot
- Google — https://developers.google.com/maps/launch-stages
- Directions on Microsoft — https://www.directionsonmicrosoft.com/user-beware-when-a-microsoft-product-preview-remains-perpetual/
- Usage AI — https://www.usage.ai/blogs/aws/rds/aurora-serverless-v2/
- infoq — https://www.infoq.com/Cloud/news/1947
- infoq — https://www.infoq.com/news/2022/08/google-iot-core-discontinued/
EDITORIAL BRIEF
Commissioned from our research desk. Subject to final editorial discretion.
Why designing against a vendor's roadmap is one of the most under-scrutinized bets in technical strategy. Describe the pattern: a capability gap gets closed on a slide during the procurement cycle, the architecture assumes it, and eighteen months later the feature is still in limited preview while the workaround has calcified into a load-bearing component. Research vendor GA slippage patterns, how rarely contracts contain feature-delivery remedies, and what Gartner-style hype cycle positioning actually predicts about delivery. Takeaway: architect only against what is generally available and contractually committed, and price the workaround as permanent.