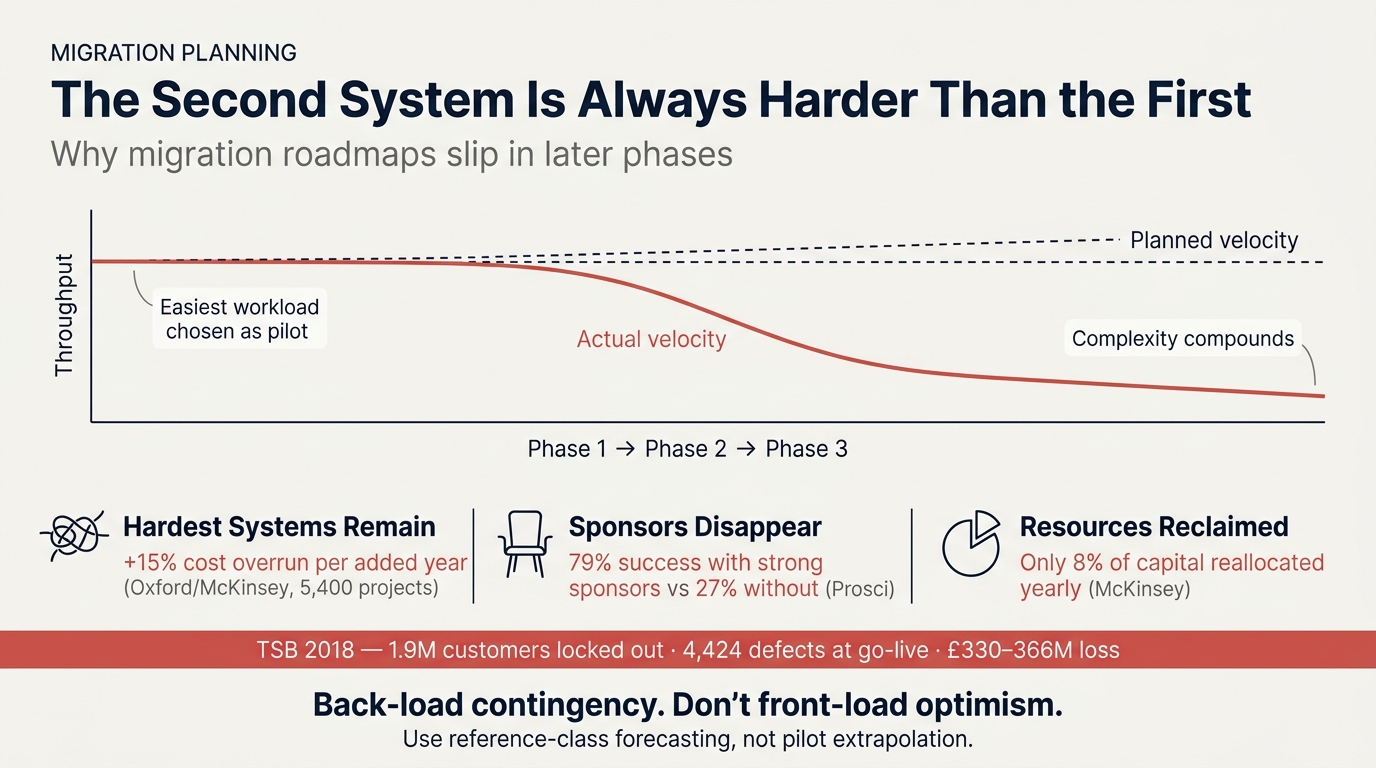
Every migration program I've worked on hits the same trap. The first system goes well, the steering committee is pleased, and someone, usually a confident PMO, extrapolates that velocity into a roadmap promising the rest of the portfolio moves at the same pace. Phase two arrives, the wheels come off, and people treat it as bad luck. It's built into how we plan.
AWS's playbook tells teams to "migrate the applications with the lowest complexity first." Microsoft, Google, Fowler, Newman, and Cockcroft all say the same. Every credible methodology picks the easiest workload as pilot, so the pilot is, by construction, a sample of your easiest work. Using its throughput to forecast the rest is like timing the first flat kilometer of a marathon and budgeting away the hills.
What follows is harder for reasons that compound. Lehman's second law: systems surviving in production for decades accumulate complexity nobody fully understands. The systems you postponed are not randomly hard. They are systematically the hardest things you own. McKinsey and Oxford studied 5,400+ large IT projects and found each additional scheduled year adds roughly 15% to cost overrun, because later phases inherit debt and integration risk that earlier phases ignored.
Then sponsorship evaporates. Median CIO tenure at a Fortune 1000 firm is about 4.6 years, and CEO turnover hit a record in 2025. A serious migration runs three to five years, so the executive who approved phase one likely won't be accountable for phase two. Prosci's data shows projects with strong sponsors succeed about 79% of the time, weak ones 27%.
The protected resource bubble disappears. McKinsey shows the average company moves only 8% of its capital between years. By phase two, last year's commitments are locked in, business as usual has reclaimed the engineers you borrowed, and your migration competes against itself for talent and budget.
TSB's April 2018 collapse is the case I keep returning to. Pre-migration phases ran cleanly. The big-bang cutover of five million customers locked nearly two million out of their accounts, generated 222,000 complaints, and cost £330 to £366 million. The Slaughter and May report found 4,424 defects open at go-live. None surfaced in phase one because phase one wasn't large enough.
The lesson is practical. Stop modeling the back half of a migration as an extrapolation of the front half. Use reference-class forecasting, anchored on comparable programs rather than your own pilot. Netflix took seven years. Capital One took eight. Complex multi-country S/4HANA programs run 30 to 42 months on the optimistic side. Treat phase two as a new program with its own budget, sponsor commitments, and contingency. Back-load slack into the long tail, where the snowflakes live.
The second system is harder because the first was chosen to be easy. Everything downstream flows from that single decision.
Why second migrations break: a research brief
Audience: VPs, CTOs, Directors of Engineering. Purpose: Evidence pack for a LinkedIn post arguing that second and subsequent system migrations in enterprise programs are typically harder than the first, contrary to stakeholder intuition. All claims are tied to primary sources where possible; statistics that could not be traced to a defensible primary are flagged.
1. Pilot selection bias: easy systems are chosen first, by design
Every major hyperscaler methodology and analyst framework explicitly instructs teams to migrate the easiest systems first. This is doctrine, not anecdote.
AWS Migration Acceleration Program (official prescriptive guidance):
"Fail fast. You should start with a few, low-complexity applications and apply your learnings to later waves. In early waves (waves 1 to 5), select fewer servers (less than 10), low-complexity applications, and applications in lower environments, such as development or test environments... If you are using a portfolio discovery tool and it has a complexity scoring feature, use it in wave planning. Migrate the applications with the lowest complexity first."
[docs.aws.amazon.com/prescriptive-guidance/latest/large-migration-portfolio-playbook/wave-planning.html]
AWS MAP 2.0 community playbook makes the velocity illusion explicit: "Wave 0 is your learning wave. Expect it to take 2 to 3x longer than planned... After Wave 0, throughput typically doubles in each subsequent wave." This is the institutionalized basis for extrapolating from pilot velocity, despite pilot velocity being a sample of the easiest workloads.
Martin Fowler, Asset Capture pattern (2004), the foundational strangler companion piece:
"Often the best assets to start with are either simple assets (because they are quick to get going) or those that have needs that are particularly difficult to handle with the old system." [1]
Sam Newman, Monolith to Microservices (O'Reilly, 2019) recommends starting with a low-risk extraction, typically a peripheral capability that is loosely coupled and well-understood. Quoting Fowler: "If you do a big-bang rewrite, the only thing you're guaranteed of is a big bang."
Adrian Cockcroft (Netflix → AWS VP): "Start with the simplest possible thing you can transition, make sure it's not customer-facing, and test it in the new system. You should establish your risk boundaries, and move them forward as you have more successes."
The mechanism: pilots are engineered to succeed via selection. The throughput numbers from Wave 0 and Wave 1 then anchor stakeholder expectations and budget forecasts for the remaining portfolio, which is by construction harder. AWS itself frames this as a feature (continuous improvement); senior leaders frequently interpret it as proof the program is on track.
2. The "70 percent fail" statistic and what it actually means
The most-cited primary source is McKinsey senior partner Harry Robinson (2019): "The academic research is really clear that when corporations launch transformations, roughly 70 percent fail." [mckinsey.com] The lineage runs back to John Kotter, Leading Change (1996), and Hammer and Champy, Reengineering the Corporation (1993).
The supporting McKinsey surveys: a 2010 survey of 2,314 executives and a 2014 survey of 1,946 executives (1,713 with recent transformation experience) found less than one-third report success on both performance and sustainment. The 2021 McKinsey article Losing from day one concluded that "about half of a transformation's value is realized within the first 18 months," with the rest leaking in later phases as leaders disengage. [2]
BCG, Flipping the Odds of Digital Transformation Success (October 2020), n=825 executives plus 70 BCG transformations:
- 30% met or exceeded targets and produced sustainable change (win zone)
- 44% delivered some value but missed targets (worry zone)
- 26% delivered less than half of target value with no sustainable change (woe zone)
Bain Transformation and Change Survey (April 2024), n=400+ executives: "Only about 12% achieve their original ambition." Earlier Bain framework: 20% fail completely, 68% partial, 12% meet goals. [bain.com/about/media-center/press-releases/2024] [3][4]
Counter to the pessimistic narrative: Mark Hughes (University of Brighton, 2011) audited the five most prominent published instances of the 70% claim and found "absence of valid and reliable empirical evidence" in every one; he calls it a "phantom statistic." Hammer and Champy themselves labeled their original 50 to 70% estimate "unscientific." The honest distribution is closer to 30% succeed fully, 50% partial, 20% outright fail [rainmanadvisory.com.au; learningaccelerators.com]. BCG's data shows the same six discipline factors can flip success rates from 30% to 80%, meaning failure is not destiny; it is correlated with weak execution patterns that compound across phases. [5][5]
Prosci Best Practices in Change Management (longitudinal since 1998, 12th edition draws on more than 4,500 leaders across 65 countries):
- "Sponsorship has been identified as the greatest top contributor to change management success in every Prosci study since 1998... cited over three times more than the next factor."
- "Projects with extremely ineffective sponsors were only 27% likely to meet their objectives as compared to 79% with extremely effective sponsors; a nearly threefold increase."
- "Sponsors must do more than sign the charter, and they cannot launch and leave."
Korn Ferry, age and tenure in the C-suite (2019, refreshed 2024): average CIO tenure 4.6 years at Fortune 1000 firms, slightly higher in energy (5.3), shorter in financial services (~4). [6]
Russell Reynolds Global CEO Turnover Index (2024 and 2025): 234 CEO departures in 2025 (record), 202 in 2024; average outgoing CEO tenure has dropped to 7.1 years, down from 8.3 in 2021. 53% of Fortune 500 top technology officers were externally hired; 42% from a different industry. [russellreynolds.com/en/insights/articles/architects-of-change-technology-leadership-in-the-fortune-500] [7]
The arithmetic: a typical multi-phase migration runs 3 to 5 years; CIO median tenure (4.6) is shorter than the program. The base-rate expectation is that the executive who approved the program will not be present for phase 2, and the replacement, often external and often from a different industry, has strong incentive to reset direction. CIO.com analysis: "Within their limited tenure, the reality is that a CIO probably only has a runway of two or three years to demonstrate progress. That's not enough to complete a big transformation project."
Gartner corroborating data on attention decay: "At least 30% of generative AI projects will be abandoned after proof of concept by the end of 2025, due to poor data quality, inadequate risk controls, escalating costs or unclear business value." [gartner.com, July 29, 2024, Rita Sallam] This is the most recent primary-source measurement of executive impatience eroding sponsorship between pilot and scale. [8]
4. Pilot purgatory: the documented pilot-to-scale gap
McKinsey originated the term pilot purgatory. The headline data points, all from primary McKinsey publications:
- May 2017 IoT survey: "Less than 30% of pilots are starting to scale. 84% of companies were stuck in pilot mode for over a year and 28% for over two years."
- 2018 Industry 4.0 Global Expert Survey: companies launch on average ~8 pilots; only ~30% successfully scale.
- 2020 WEF Global Lighthouse Network follow-up: "At least 70% of manufacturers are languishing in pilot purgatory."
The diagnosis from McKinsey itself: pilots succeed because they have a dedicated bubble of sponsorship, talent, and budget. Scale fails when that bubble pops and the program has to operate at normal organizational metabolism. BCG echoes the point in Flipping the Odds: "Management identifies and frees up the most capable resources to drive the transformation program" is one of six success factors most often missed in phase 2.
Counter-evidence to note: LNS Research (2019 to 2021) surveys found only 7 to 13% of industrial firms self-identify as "stuck in pilot," arguing pilot purgatory is overstated by consultants who profit from prescribing the cure.
5. Resource contention dissolves the protected bubble
McKinsey's resource-allocation research (Hall, Lovallo, Musters, 2012; refreshed 2023): "83% of executives identify reallocation as the top management lever for spurring growth. Yet a third of companies reallocate a measly 1% of their capital from year to year; the average is 8%." A 90% year-over-year correlation in investment spending persists across firms.
Implication for phase 2: the "protected bubble" that funded phase 1 had to fight for a share of that 8% reallocation. By phase 2, last year's commitments are locked in, BAU work resumes its claim on engineering capacity, and the program competes against itself. This is structural, not behavioral.
Documented exhibit: McKinsey's 2020 cloud migration study of ~450 CIOs found a global pharmaceutical company set out to move nearly all workloads to cloud and "at the end of 12 months had shifted only 40% of its first-year target. Overwhelmed, the company cut the scope of its cloud-adoption plans by roughly 50%... the program now more than three quarters behind plan and costing 50% more than budgeted."
6. Empirical slippage data by migration category
6.1 Baseline anchors across all categories
McKinsey-Oxford 2012 study, more than 5,400 IT projects (initial budget >$15M; average $167M, largest $33B):
- Average 45% over budget, 7% over schedule, 56% less value delivered than predicted [9]
- 17% threaten the existence of the company ("black swans" with 200 to 400% cost overruns)
- Each additional scheduled year adds 15% to cost overrun, the strongest published evidence that later phases slip more, because they inherit accumulated technical debt and integration risk
Flyvbjerg and Budzier, HBR 2011, n=1,471 IT projects: average 27% cost overrun, but one in six is a Black Swan (mean 200% cost, 70% schedule overrun). Distribution has a fat tail; large IT projects are riskier than executives model. [10]
Standish CHAOS 2020 (Beyond Infinity), ~50,000 projects analyzed: large projects succeed less than 10% of the time; 31% of US IT projects canceled outright in 2020. Methodology contested (Eveleens and Verhoef 2010, IEEE Software); use as directional. [11]
6.2 Cloud migrations
McKinsey 2020 Cloud Migration Opportunity, n=~450 CIOs:
- 75% go over budget; 28% are >20% over; only 7% under budget
- 38% delayed by more than a quarter; 13% by more than three quarters
- Average 14% annual overage on migration spend; global ~$100B in wasted migration spend over three years
Flexera State of the Cloud 2025: 84% identify managing cloud spend as their top challenge (#1 two years running); organizations exceed cloud budgets by an average of 17%; 27% of cloud spend is wasted; only 21% of cloud workloads have been repatriated.
Gartner: organizations without cost optimization overspend by up to 70%. 30% of GenAI projects abandoned after POC by end-2025 (named direct release). [8]
IDC June 2024: ~80% expect some repatriation in next 12 months; only 8 to 9% plan full workload repatriation, confirming that cloud migrations more often stall in place than reverse. [12]
Documented multi-year cloud migrations:
- Netflix: August 2008 to January 2016, a 7-year rebuild from monolith to hundreds of microservices. Netflix retrospective explicitly notes billing was the final and hardest workload, completed weeks before global launch to 130 new countries. [13]
- Capital One: 2012 to 2020, 8 years to exit 8 data centers, rebuilding ~80% of ~2,000 apps cloud-native. Velocity accelerated late: change frequency up >300% from 2016 to 2019. A success case, but eight years long. [14]
- Dropbox Magic Pocket: 2.5 years to repatriate ~600 PB; saved $75M over two years per SEC IPO filings. [15]
- 37signals/DHH: AWS bill peaked at $3.2M/year; cloud exit projected ~$10M savings over 5 years; AWS waived $250K in S3 egress to enable exit.
6.3 Mainframe modernization
GAO-25-107795 (July 2025): of the 10 most critical federal legacy systems flagged in 2019, only 3 had been modernized as of February 2025, roughly 6 years later. Of the remaining 7: four projected within "the next few years," two within 5+ years, one with no planned completion date. The federal government spends >$100B annually on IT; roughly 80% on O&M of existing systems. [16][17]
IRS CADE/CADE2: CADE 2 initiated 2009 to replace the 60-year-old Individual Master File (a COBOL/Assembler system for ~1 billion taxpayer records). GAO-22-104387: key milestone slipped from 2014 to 2023, a 9-year delay, which the IRS's own quarterly reports did not disclose because they "do not include programs' historical cost and schedule goals." IRS now targets IMF retirement in fiscal 2028. [18]
Industry context (hardest left for last): ~71% of Fortune 500 still rely on mainframes; 92 of top 100 banks; ~220 billion lines of COBOL in production with 1.5B added annually; 95% of ATM swipes touch COBOL; 43% of global banking systems use COBOL (>60% for banks with >$50B assets). Average COBOL programmer is 58; ~10% retiring annually. [thenewstack.io; cobolpro.com; mechanical-orchard.com] [19]
6.4 ERP migrations (SAP S/4HANA, Oracle, Workday)
ISG 2025 SAP S/4HANA migration study (200+ enterprises): "Almost 60% of SAP migrations fall behind schedule and budget, mostly due to underestimated complexity, expanded scope, and internal capacity bottlenecks." Only 18% implement new SAP processes; 49% retain existing processes. [20][20]
Basis Technologies SAP Adoption Model (2024): of ~35,000 original ECC customers, only ~28% were live by end of 2023; ~57% projected by end of 2027 when SAP's mainstream maintenance ends. Typical complex multi-country migration: 30 to 42 months.
Precisely + ASUG 2026 trends study: 59% of companies fully or partially live on S/4HANA (up 13 points YoY); top migration barriers are business process change (49%), customizations (44%), and organizational resistance (37%).
Panorama Consulting 2024 ERP Report: >25% of organizations exceeded budgets; leading causes: underestimating staffing (38%), expanding scope (35%), technical/data issues (34%).
Named ERP failures, with primary-source figures:
| Program | Year | Outcome |
|---|
| Lidl / SAP eLWIS | 2011 to 2018 | Phase 1 (Austria) ran "like clockwork"; SAP awarded Lidl best-customer prize April 2017.Best Practice GroupPhase 2 (10,000 stores, 28 countries) collapsed over purchase-vs-retail inventory valuation. Abandoned July 2018.€500M write-offComputer WeeklyTechRepublic |
| Hershey's | 1999 | Compressed 48-month plan to 30 months;Slackchannelsbig-bang Halloween go-live.**$100M of Kisses orders unshipped;**stock down 35%;SlideShareQ3 revenue down $150M YoY |
| Target Canada | 2011 to 2015 | Greenfield SAP. Data accuracy ~30%(vs 98 to 99% in US);Innovapteempty shelves; bankruptcy January 2015; ~**$2B direct loss, ~$7B total cost;**Panorama-consulting17,600 jobsCanadian BusinessBlue Link ERP |
| Revlon / S/4HANA | 2018 | Oxford NC go-live;TechTarget**$64M sales unfulfilled;**$54M remediation;Brightwork Research$70.3M net loss; investor class actions;Computer WeeklyCFO resigned |
| Haribo / S/4HANA | 2018 | Multi-country master-data conversion collapsed;Decision ResourcesLinkedIn**~25% drop in Gold Bear gummy sales**in 2018TechRepublicDecision Resources |
| National Grid / Wipro | 2012 | Go-live during Hurricane Sandy;UpperEdgebook-close stretched from4 days to 43 days;~850 stabilization contractors at**$30M/month for two years;****$585M cleanup cost**(150% of original);HenricodolfingWipro paid $75M settlementCTRM Center |
| Avon / SAP "Promise" | 2013 | Canadian pilot caused reps to quit in "meaningful numbers"Information Week(~16,000 reps lost); rollout halted.Information Week**$100M to $125M write-off**Calleam |
| Queensland Health | 2010 | 10 aborted go-live attempts;Cabinet~78,000 staff received wrong or no pay;ResearchGateWikipedia1,507 SAP + 1,029 Workbrain customizations;Academia.eduHenrico Dolfing**~AU$1.25B lifetime cost over 8 years** |
| MillerCoors / HCL | 2017 | Sued HCL for**>$100M**over SAP failures;TechTargetCMSCsettled later in 2017TediumTechTarget |
6.5 Monolith to microservices
Amazon Prime Video Video Quality Analysis (March 2023): the team migrated a single workload from distributed Step Functions/Lambda back to a consolidated process on ECS; >90% infrastructure cost reduction. Marcin Kolny: "Some components hit a scaling limit at around 5% of the expected load." Important caveat: this is one workload, not Prime Video as a whole. [21][22]
Segment "Goodbye Microservices" (2018): consolidated 140+ destination microservices (16,000 containers across 250 services) back into a monolith ("Centrifuge"). CTO Calvin French-Owen: with 200 third-party APIs each having one bad day per year, "we are seeing an outage every day and a half." [23]
Netflix Cosmos (2018+): Netflix itself is running a multi-year migration off its "large and complicated legacy" Reloaded media-processing platform, illustrating that even the canonical microservices pioneer is still strangling its own legacy. [24]
Less rigorous public statistics, but the qualitative picture is consistent: Hadoop-to-cloud migrations typically run 12 to 24+ months, with stall points around Hive-to-Snowflake/BigQuery SQL translation, Oozie workflow rewrites, Spark refactoring, and metadata/partitioning inconsistencies. Teradata-to-Snowflake/BigQuery/Redshift programs commonly run 18 to 36 months. [25]
7. Named "phase 1 fine, phase 2 catastrophic" case studies
TSB Bank / Sabadell (April 2018), the canonical example
TSB ran phased pre-migration in 2017 (smaller cohorts, branch hardware, ATMs) without major public incident. Phase 2, the big-bang April 2018 migration of 5 million customers, collapsed: up to 1.9 million customers locked out; 232 days to return to BAU; 222,492 complaints; ~£32m direct compensation; 80,000 customers lost; total cost £330m to £366m; FCA fined £29.7m, PRA £18.9m. [26]
Slaughter and May independent report findings:
- Two data centers "configured inconsistently"; performance testing run on only one of two: "As the decision was taken to conduct performance testing on a single data centre, it was impossible to identify these issues before Go Live." [27][28]
- 4,424 defects open at go-live (contested by TSB, which claimed only 98 were migration-related; Slaughter and May rejected this). [26][29]
- "TSB did not give sufficient consideration to whether a largely single event migration was the right choice... This choice was not substantively discussed by TSB's board." [29]
FCA's Mark Steward: "The failings in this case were widespread and serious which had a real impact on the day-to-day lives of a significant proportion of TSB's customers, including those who were vulnerable." [28]
Phoenix Pay System (Canada): pilot warnings ignored, then phase 2 expansion
- IBM contract: June 2011 at $5.7M; amended 47 times to $185M; total contract value $407.5M; IBM's decade take >$851M. [30]
- A pilot with one department was cancelled June 2015 after "major defects and instability." No formal risk reassessment before proceeding. [31][31]
- Phase 1 (Feb 2016): 34 departments; ~30% of users reported pay errors immediately. [31]
- Phase 2 (April 2016): rolled out anyway to 67 more departments. By July 2018, ~80% of 290,000 public servants had pay problems. [31][32]
Auditor General Michael Ferguson: an "incomprehensible failure"; executives "had received more than enough information and warning that Phoenix was not ready" but "prioritized meeting schedule and cost over other critical elements, such as functionality and security." [33]
Cost trajectory: planned savings $70M/year. Actual cost by 2025: C$4.34B, with another C$521M planned for 2026 to 2027. [34]
NHS National Programme for IT (NPfIT)
Launched 2002 at £6.2B budget; total spend £9.8B to £12.7B (NAO/PAC). Phase 1 (PACS digital imaging, Spine messaging backbone) succeeded and remains in use. Phase 2 (Detailed Care Records, £5B budget) never delivered. Accenture withdrew September 2006 and was charged just £63m of a possible £1B penalty. PAC verdict (2013): one of the "worst and most expensive contracting fiascos" ever. [35]
Healthcare.gov (October 2013)
v1 (2010, Jekyll static site) was a quiet success. v2 launch crashed within 2 hours; only 6 people enrolled day one. CGI contract: $93.7M → $292M pre-launch → $1.7B (OIG); >$2B per Bloomberg/CMS later. A McKinsey red-team report in March 2013 had warned of failure; ignored. Mickey Dickerson's rescue effort directly birthed the US Digital Service and 18F. [36]
Queensland Health Payroll (Australia, 2010)
IBM contract: $6.19M (2007) → $181M (2008) → ~$101M scaled-down "interim" version. Go-live March 2010 after 10 aborted attempts with 14 critical and ~1,500 severe defects. ~78,000 staff received incorrect or no pay. Commission of Inquiry (Chesterman QC, 2013) and Premier Campbell Newman: "arguably the worst failure of public administration in Australia's history." Lifetime cost AU$1.25B over 8 years. IBM staff had improperly accessed competitors' tender data; Queensland barred IBM from new contracts. [37]
Universal Credit (UK DWP)
NAO June 2018: originally due to complete October 2017; eight years in, only ~10% of expected caseload were claimants. Running cost £699 per claim vs target £173. Amyas Morse: "the project is not value for money now, and that its future value for money is unproven." [38][39]
IRS Individual Master File
GAO data: 25 to 64-year-old applications; software up to 15 versions behind; IMF crashed on Tax Day 2018 due to a caching issue. CADE 2 milestone slipped 2014 to 2023 (9 years). IMF retirement now targeted for fiscal 2028. [40]
8. The hardest system is left for last: long-tail mechanics
Two reinforcing dynamics drive the long-tail problem.
Lehman's laws of software evolution (Lehman and Belady, 1974 onward). Law II (Increasing Complexity): "As an E-type system evolves, its complexity increases unless work is done to maintain or reduce it." Herraiz et al. (2013) empirically validated Laws I, II, and VII across modern systems including the Linux kernel. By Lehman's logic, the systems left for last are not coincidentally harder; they are systematically the most complex by definition, having accreted decades of changes without commensurate refactoring.
Conway's law during migration (Fowler): "The modular decomposition of a system and the decomposition of the development organization must be done together... evolution of the architecture and reorganizing the human organization must go hand-in-hand throughout the life of an enterprise." Without org restructuring, the new architecture inherits the seams of the old org, producing what Kelsey Hightower calls a distributed monolith. This is a major source of phase-2 collapse: phase 1 ships into a clean greenfield; phase 2 has to integrate with the unchanged org and unchanged seams.
The Fowler reference case never finished. Fowler's canonical 2004 StranglerFigApplication example (Chris Stevenson and Andy Pols at an energy trader) never finished strangulation per Paul Hammant's case-study writeup: "They aren't yet at the point where the old application is strangled." Sam Newman recounts a separate Thoughtworks engagement: "I spoke to Peter last year, about six years on, and ThoughtWorks still haven't changed the architecture. It's still running quite happily." [41]
9. Conceptual frameworks senior leaders should know
Cone of uncertainty (Boehm, 1981): project estimates have a 0.25x to 4x range at project start. The cone narrows only if real discovery is happening. In migrations, hidden dependencies repeatedly widen the cone after the pilot.
Planning fallacy and reference-class forecasting (Kahneman; Flyvbjerg). Kahneman in Thinking, Fast and Slow (p. 251) calls Flyvbjerg's reference-class forecasting "the single most important piece of advice regarding how to increase accuracy in forecasting." Flyvbjerg identifies three biases that map directly onto migration programs: [42]
- Planning fallacy "writ large": systematic underestimation from the inside view. [43]
- Uniqueness bias: "our project is different, regardless of the degree of similarity with previous examples." Most enterprises use pilot velocity (a sample of the easiest projects) as their reference class. [43]
- Strategic misrepresentation: deliberate distortion to secure approval. [43]
Escalation of commitment (Staw, 1976; Whyte; Keil et al.). Decision-makers personally responsible for the initial decision are statistically far more likely to commit additional resources to a failing course of action. Keil's MIS Quarterly work shows the effect generalizes in IT specifically. Mega-project illustrations: Denver International Airport baggage system (+$560M, 16 months delay); Sydney Opera House (14x over budget); Canadian Firearms Registry (1,000x overrun). [44]
Innovation theater (Steve Blank, HBR 2019): "Companies and government agencies typically adopt innovation activities that result in innovation theater... The reorg keeps everyone busy for a year, perhaps provides new focus on new regions or targets, but in the end is an inadequate response." A successful pilot can produce demo-grade outcomes (a Wave 1 dashboard, a flagship service on Kubernetes) without changing the actual cost or capability curve.
The iceberg of hidden dependencies. No clean academic statistic, but Newman's database-decomposition work and multiple QCon retrospectives converge: the data tier is where strangler patterns most often stall. Shared schemas, FK constraints, and CDC pipelines marked "temporary" become permanent. Gergely Orosz: "Migration long-tails are common, risky and often cause outages... there is little incentive for engineers to spend time on these, or build the migration muscle."
10. Counter-arguments: when subsequent migrations genuinely get easier
The honest counter-narrative is not "subsequent migrations are always easier" but rather: the pattern is workload-shaped, not migration-shaped. Homogeneous mechanical work compounds; bespoke long-tail work does not.
Cases where migrations compound positively:
- Capital One rebuilt ~1,600 of ~2,000 apps cloud-native over 8 years; release frequency rose >300% from 2016 to 2019; provisioning dropped from months to minutes. [14][14]
- Mayden migrated 300 servers to AWS in 6 weeks using AWS Cloud Migration Factory. [45]
- Fanatics Commerce migrated 1,800 servers across 5 data centers with no degradation between waves. [46]
- Commonwealth Bank of Australia completed an 18-month migration of its SAP core to AWS in 2025 to 2026 (its second major core program, after 2008 to 2013), achieving 30% infrastructure cost reduction, 30% performance improvement, and failover engineered to sub-2-minute. General Manager Simon Davies: "There are very few banks in the world that have a real-time core ledger." [47]
Enabling conditions:
- Homogeneous fleets (similar JVMs, similar databases)
- Platform engineering and paved roads (Netflix Paved Road, Spotify Backstage) [48][48]
- IaC + migration tooling (AWS AMS, Azure Migrate, VMware HCX)
- Codified runbooks and a Cloud Center of Excellence
- Templated SaaS rollouts (Office 365, Salesforce)
Where "easy first, hard later" is false:
- Mechanical lift-and-shift with clean dependencies
- Hard-deadline data center exits (colo expiry forces completion)
- Hardware refresh cycles with vendor EOL
- Templated SaaS migrations where each tenant uses identical playbooks
The shape of the cost curve. Empirically, large-scale migration cost-per-workload follows a U or hockey-stick pattern: initially high (foundation, landing zone, learning), drops sharply during the factory middle, then rises steeply on the last 10 to 20% of long-tail systems where each is a snowflake. This explains the experiential intuition behind "the second migration was harder"; what is actually being observed is the end-tail of a single migration, not a fresh start.
BCG's six factors that flip success rates from 30% to 80%: integrated strategy with clear goals; leadership commitment from CEO through middle management; high-caliber talent; agile governance; effective outcome monitoring; business-led modular technology platform. BCG: "successful transformations also set companies up for sustained success; they won't have to digitally transform again."
11. Statistics to use and statistics to avoid
| Use these (primary-sourced) | Avoid these (unsourceable to primary) |
|---|
| McKinsey 2014 survey, 1,946 execs: less than one-third report success | "Gartner says 80% of digital transformations will fail" (could not locate primary release) |
| BCG 2020: 30/44/26 win-worry-woe split, n=825 | "Gartner says 85% of pilots fail to scale" (paraphrase, no discrete release) |
| Bain April 2024: 88% miss original ambition, n=400+ | "$2.3T lost annually to failed transformations" (no traceable source) |
| Prosci: 79% success with effective sponsor vs 27% without | Various "50 to 74%" mainframe migration failure rates (vendor-published, untraceable) |
| McKinsey IoT 2017: <30% pilots scale; 84% stuck >1 year | "94% of federal IT projects fail" (Standish-derived, methodology contested) |
| Gartner July 2024: 30% of GenAI projects abandoned after POC | |
| McKinsey-Oxford 2012: 45% over budget, 7% over time, 56% less value | |
| Flyvbjerg/Budzier HBR 2011: 1-in-6 Black Swan, 200% cost / 70% schedule | |
| Korn Ferry: CIO tenure 4.6 years | |
| Russell Reynolds 2025: 234 CEO departures, 7.1-year avg tenure | |
| Flexera 2025: 84% top challenge, 27% spend wasted, 17% over budget | |
| GAO-25-107795: 3 of 10 critical federal systems modernized in 6 years | |
| Slaughter and May TSB report: 4,424 defects open at go-live | |
| Phoenix OAG (2018): $5.7M → C$4.34B by 2025 | |
12. Synthesis: why the second migration is structurally harder
The structural reasons assemble into a coherent argument.
One, every major methodology (AWS MAP, Microsoft, Google, Fowler, Newman, Cockcroft) explicitly directs teams to migrate the easiest systems first. Pilot velocity is therefore a sample of the easiest workloads.
Two, by Lehman's Law II, what remains is systematically the most complex by definition. The hardest 20% of the portfolio takes the majority of the effort, a pattern visible in GAO mainframe data (3 of 10 in 6 years), SAP S/4HANA adoption (28% live by end-2023 of original ECC base), and Capital One's 8-year all-in journey.
Three, the resulting pilot velocity is then used as the reference class for the rest of the program, a planning-fallacy error in Flyvbjerg's sense. McKinsey-Oxford's 15%-cost-overrun-per-additional-scheduled-year is the empirical corollary.
Four, the protected bubble of phase 1 dissolves. McKinsey's 8% average annual capital reallocation means phase 2 must compete against last year's locked-in BAU. Prosci's 79%-vs-27% sponsor effect, combined with Korn Ferry's 4.6-year CIO tenure and Russell Reynolds' record CEO turnover, ensures the sponsoring executive is statistically not present for phase 2.
Five, escalation of commitment (Staw, Keil) and innovation theater (Blank) make program leaders reluctant to admit the velocity curve was a sampling artifact. Phoenix, Lidl, NPfIT, Healthcare.gov, and TSB all show the pattern: pilot success generates political momentum that suppresses risk escalation.
Six, Conway's law guarantees that without an org redesign (which most programs skip), the new architecture inherits the seams of the old org. Phase 1 ships into greenfield; phase 2 has to integrate with the unchanged human and system topology.
The intellectually honest framing for senior leadership: experience makes routine migrations easier and bespoke migrations roughly as hard as they always were. Whether the program feels easier or harder depends on (a) how much of the fleet is homogeneous and (b) whether the organization has invested in platform engineering and a paved road. Without both, what teams interpret as "second-system effect" is actually the absence of factory infrastructure combined with the long tail of systems that were deferred precisely because they were hardest.
The actionable implication for VPs, CTOs, and Directors of Engineering: treat phase 2 budgets and timelines as a new program, not an extrapolation of phase 1. Apply reference-class forecasting using comparable past programs (Netflix 7 years, Capital One 8 years, GAO federal systems averaging far longer than planned, SAP S/4HANA at 30 to 42 months for complex multi-country) rather than pilot velocity. Plan for sponsor turnover. Budget for the long tail. And, per BCG's data, the six discipline factors that flip success rates from 30 to 80% are the actual differentiator, not pilot success.
- Martin Fowler — https://martinfowler.com/tags/2004.html
- McKinsey & Company — https://www.mckinsey.com/capabilities/people-and-organizational-performance/our-insights/a-better-way-to-lead-large-scale-change
- MeltingSpot Blog — https://blog.meltingspot.io/why-digital-transformation-projects-fail/
- MeltingSpot — https://meltingspot.io/en/blog/why-digital-transformation-projects-fail
- Learningaccelerators — https://www.learningaccelerators.com/do-70-of-transformations-fail/
- CIO Dive — https://www.ciodive.com/news/cio-succession-next-generation-tech-leaders/601848/
- Russell Reynolds Associates + 6 — https://www.russellreynolds.com/en/insights/reports-surveys/global-ceo-turnover-index/what-todays-ceo-turnover-means-for-boards-and-succession
- Gartner — https://www.gartner.com/en/newsroom/press-releases/2024-07-29-gartner-predicts-30-percent-of-generative-ai-projects-will-be-abandoned-after-proof-of-concept-by-end-of-2025
- Applexus — https://www.applexus.com/blogs/realizing-business-value-from-digital-transformation-initiatives
- arxiv — https://arxiv.org/pdf/1304.0265
- Faeth Coaching — https://faethcoaching.com/it-project-failure-rates-facts-and-reasons/
- CIO + 2 — https://www.cio.com/article/2520890/the-great-repatriation-it-leaders-reset-cloud-strategies-to-optimize-value.html
- Tocconsulting + 2 — https://tocconsulting.fr/blog/netflix-cloud-architecture
- Diginomica — https://diginomica.com/capital-one-closes-its-data-centres-and-goes-all-aws
- Sangfor Technologies — https://www.sangfor.com/blog/cloud-and-infrastructure/what-cloud-repatriation
- Gao — https://files.gao.gov/reports/GAO-25-107795/index.html
- mLogica — https://www.mlogica.com/resources/blogs/agencies-need-to-continue-addressing-critical-legacy-systems
- Nextgov.com + 2 — https://www.nextgov.com/digital-government/2021/10/a-60-year-old-irs-it-system-wont-finish-modernizing-until-2030/259253/
- Planet Mainframe + 4 — https://planetmainframe.com/2024/10/mainframe-modernization-isnt-about-mainframe-migration/
- CIO — https://www.cio.com/article/4130935/sap-migrations-often-fail-at-the-planning-stage.html
- The Stack — https://www.thestack.technology/amazon-prime-video-microservices-monolith/
- LinkedIn — https://www.linkedin.com/pulse/amazon-prime-video-moved-from-microservices-monolith-reduced-fred-lai
- Tech Monitor + 2 — https://www.techmonitor.ai/leadership/strategy/microservices-vs-monolith
- The Register — https://www.theregister.com/2021/03/02/netflix_cosmos_serverless_microservices/
- Datafold — https://www.datafold.com/resources/hadoop-to-snowflake-migration/
- Riskonnect + 2 — https://riskonnect.com/thought-leadership/industry-news-tsbs-it-disaster-highlights-need-for-greater-operational-resilience/
- TSB Bank — https://www.tsb.co.uk/news-releases/slaughter-and-may.html
- Tech Monitor — https://www.techmonitor.ai/policy/privacy-and-data-protection/tsb-it-crash-migration-bank-fca
- Tech Monitor — https://www.techmonitor.ai/leadership/digital-transformation/slaughter-and-may-tsb
- CBC News + 2 — https://www.cbc.ca/news/canada/ottawa/phoenix-ibm-contract-union-pay-government-1.4295827
- Grokipedia — https://grokipedia.com/page/Phoenix_pay_system
- Wikipedia — https://en.wikipedia.org/wiki/Phoenix_pay_system
- Journal of Public and International Affairs + 2 — https://jpia.princeton.edu/news/burnt-by-phoenix-canadas-costly-lesson-public-financial-management
- CBC News — https://www.cbc.ca/news/canada/ottawa/federal-phoenix-pay-system-10-year-anniversary-9.7093933
- ResearchGate + 5 — https://www.researchgate.net/publication/310472449_The_UK's_National_Programme_for_IT_Why_was_it_dismantled
- GovCIO Media + 3 — https://govciomedia.com/lessons-learned-over-a-decade-with-health-care-marketplace/
- IEEE Spectrum + 8 — https://spectrum.ieee.org/ibm-sued-over-queensland-health-payroll-system-debacle
- National Audit Office — https://www.nao.org.uk/press-releases/rolling-out-universal-credit/
- Computer Weekly — https://www.computerweekly.com/news/252443157/Universal-Credit-value-for-money-unproven-says-NAO
- Tax Notes — https://www.taxnotes.com/research/federal/other-documents/gao-reports/gao-examines-irs-modernization-plans-and-cloud-computing/7fy00
- InfoQ — https://www.infoq.com/articles/migrating-monoliths-to-microservices-with-decomposition/
- Saïd Business School — https://www.sbs.ox.ac.uk/about-us/people/bent-flyvbjerg
- ResearchGate — https://www.researchgate.net/publication/397345212_Reference_class_forecasting_promises_problems_and_a_research_agenda_moving_forward
- ResearchGate + 3 — https://www.researchgate.net/publication/3076427_Effects_of_sunk_cost_and_project_completion_on_information_technology_project_escalation
- AWS — https://aws.amazon.com/blogs/mt/cost-saving-strategies-for-large-enterprise-cloud-migrations/
- AWS — https://aws.amazon.com/blogs/migration-and-modernization/category/migration-solutions/map/
- iTnews + 2 — https://www.itnews.com.au/news/how-cba-unlocked-90-percent-of-its-customer-and-transaction-data-623796
- Developer Enablement — https://developer-enablement.com/what-is-the-paved-road/
Commissioned from our research desk. Subject to final editorial discretion.